
Technical indicators in crypto: the 7 most cited by experts and how to read each one
Moving averages, RSI, MACD, Bollinger Bands, Stochastic, volume with OBV and Fibonacci: what each indicator measures, how to read it, where it fails in crypto and what three academic studies found, with sources and limits.
Quick answer
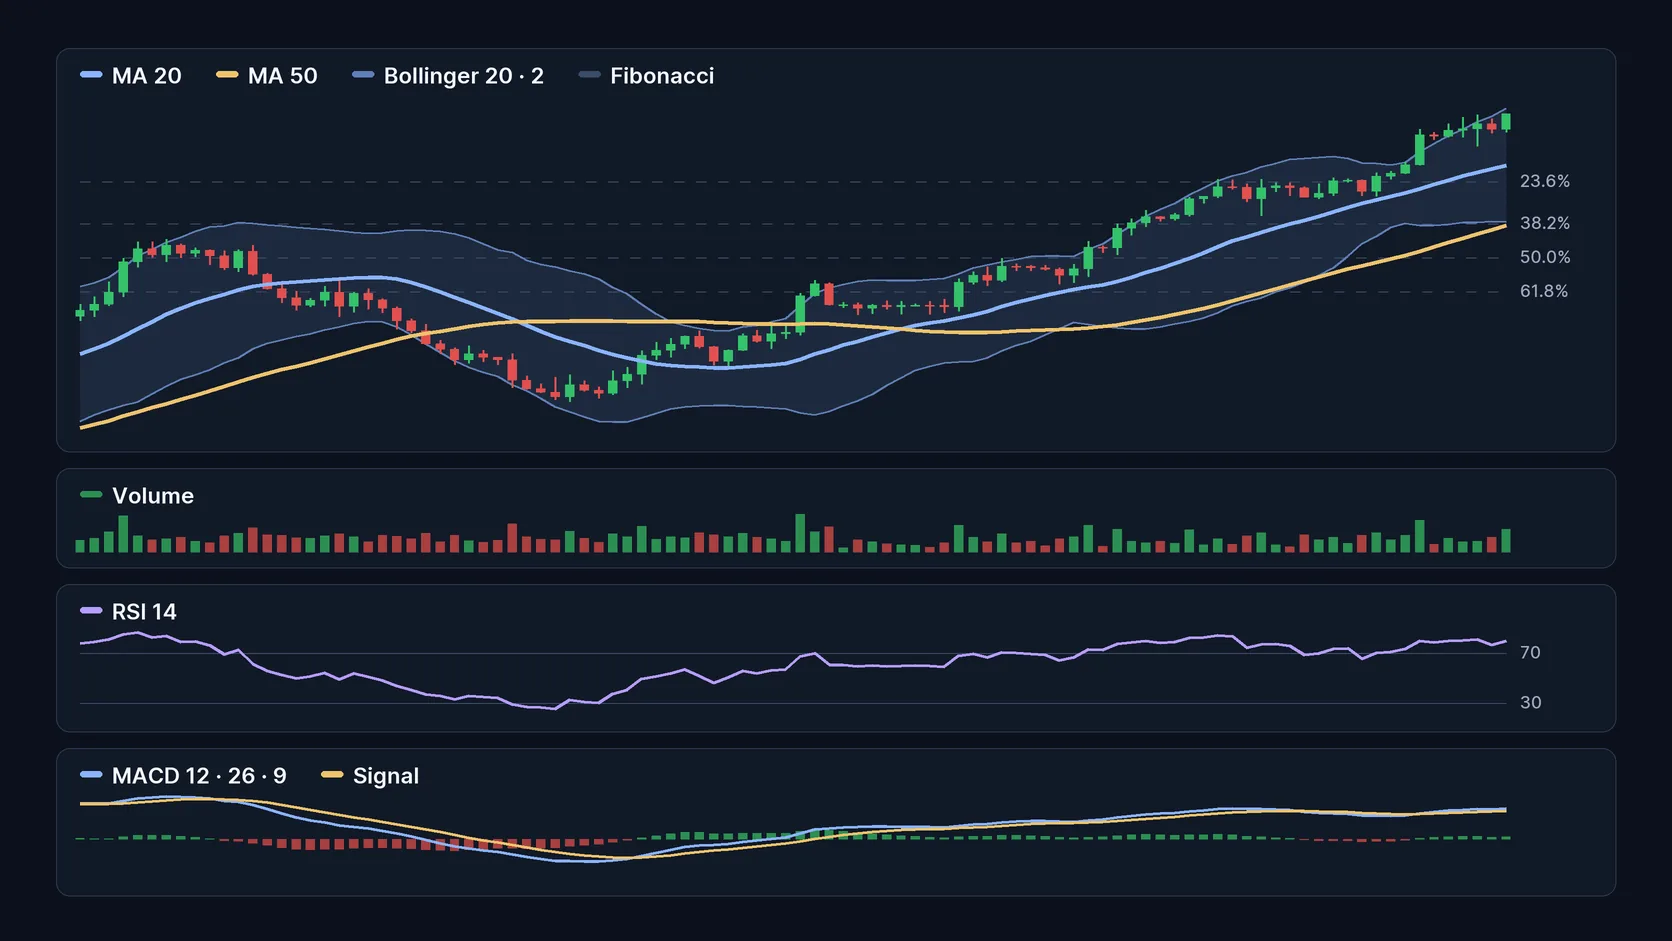
The technical indicators most often cited by reference material for analyzing the crypto market are seven: moving averages, RSI, MACD, Bollinger Bands, the Stochastic Oscillator, volume with OBV and Fibonacci retracements. The first five appear in all three lists checked for this article (Binance Academy, Kraken Learn and IG). The last two cover what the others miss: volume shows whether there is participation behind a move, and Fibonacci marks price zones that many traders watch.
None of them predicts price. They are all calculations on price and volume that have already happened, and their own creators warn that a single signal is not enough. This article explains what each one measures, how to read it, where it fails in crypto and what academic studies have found. There is no buy or sell recommendation.
How this list was built
There is no public survey that ranks indicators by use among professional analysts. We looked for one from the CMT Association, the body that certifies technical analysts, and found no published results. So "according to experts" here means three verifiable things:
- Reference lists: we counted which indicators appear in three educational guides checked on October 11, 2026: Binance Academy (updated Jun 18, 2026), Kraken Learn (Dec 30, 2025) and IG (no visible publication date).
- The indicators' authors: we used the rules of the people who created each tool, such as J. Welles Wilder (RSI), Gerald Appel (MACD), John Bollinger (Bollinger Bands), George Lane (Stochastic) and Joe Granville (OBV), as documented by StockCharts ChartSchool and by John Bollinger's own site.
- Academic studies: three peer-reviewed papers that tested technical rules on cryptocurrencies.
One caveat: Binance, Kraken and IG are companies that earn money from trading. Their guides are useful for learning what the market uses, but they are not proof that the indicators work.
| Indicator | What it measures | Default setting | Presence in the 3 lists |
|---|---|---|---|
| Moving averages | Trend direction | 50 and 200 periods are the most watched | 3 of 3 |
| RSI | Strength of the recent move | 14 periods; 70 and 30 levels | 3 of 3 |
| MACD | Shifts in trend momentum | 12, 26 and 9 periods | 3 of 3 |
| Bollinger Bands | Volatility and relative price | 20-period average and 2 standard deviations | 3 of 3 |
| Stochastic | Where the close sits in the recent range | 14 periods; 80 and 20 levels | 3 of 3 (on Binance, the StochRSI variant) |
| Volume and OBV | Participation behind the move | No parameter; running total | 1 of 3 (Kraken) |
| Fibonacci retracements | Zones of possible support and resistance | 23.6%, 38.2%, 50%, 61.8% and 78.6% | 1 of 3 (IG); mentioned by Kraken |
Source: our own count across Binance Academy, Kraken Learn and IG, checked on Oct 11, 2026. Scope: three English-language guides; it is not a sample of the market. ADX and the Ichimoku cloud also appear in IG's list and are mentioned by Kraken, but were left out to keep seven tools that measure different things.
1. Moving averages
A moving average is the average price over the last N periods, recalculated with each new candle. It smooths out noise and shows the direction of the trend. The simple moving average (SMA) gives every period the same weight. The exponential moving average (EMA) weights recent prices more heavily, so it turns sooner.
How to read it: price above a rising long average suggests an uptrend; below it, a downtrend. The 200-period average is the most popular long-term reference and the 50-period one is the medium-term reference. When the 50 crosses above the 200, the market calls it a golden cross; when it crosses below, a death cross.
Where it fails: it is a lagging indicator. It confirms a trend that has already started and does not catch tops or bottoms. In a sideways market, crossovers multiply and most of them are false. Crypto adds one more detail: the market runs 24 hours a day, so the "daily close" is a convention set by each platform, and the same average can differ slightly from one to another.
Full guide: Moving averages in crypto: SMA, EMA, crossovers and limits.
2. RSI (Relative Strength Index)
RSI was created by J. Welles Wilder and published in 1978 in the book New Concepts in Technical Trading Systems. It compares recent gains and losses and returns a number from 0 to 100. The default is 14 periods.
How to read it: above 70, the asset is considered overbought; below 30, oversold. Another reading is divergence: price makes a new high and RSI does not follow (bearish divergence), or price makes a new low and RSI makes a higher low (bullish divergence).
Where it fails: "overbought" does not mean "about to fall". In strong trends, RSI can stay above 70 for a long time, and a firm rally can show several bearish divergences before any top. According to StockCharts, overbought and oversold signals work best when price moves sideways. Because crypto tends to have long, violent trends, selling only because RSI went above 70 is a common mistake.
Full guide: RSI: how the Relative Strength Index works and how to read it in crypto.
3. MACD
MACD (moving average convergence divergence) was developed by Gerald Appel in the late 1970s. The MACD line is the 12-period exponential average minus the 26-period one. The signal line is the 9-period exponential average of the MACD line itself. The histogram is the difference between the two.
How to read it: the MACD line crossing above the signal line points to upward momentum gaining strength; crossing below, the opposite. Crossing the zero line shows that the short average has moved past the long one. Divergences between MACD and price are also watched.
Where it fails: because it is built from averages, MACD lags, and crossovers can arrive after much of the move. It has no upper or lower bound, so it is not well suited to flagging overbought levels. And its values depend on the asset's price: the MACD of Bitcoin is not comparable to that of a coin worth a few cents.
Full guide: MACD: how it works, how to read crossovers and where it fails.
4. Bollinger Bands
Created by John Bollinger, the bands are three lines: a 20-period simple average in the middle and two bands 2 standard deviations away, one above and one below. When volatility rises, the bands widen; when it falls, they narrow.
How to read it: the bands tell you whether price is high or low relative to its recent behavior. A tight narrowing (a squeeze) signals compressed volatility, which often comes before a larger move. The direction of that move is not known in advance.
Where it fails: the classic mistake is treating a touch of the band as a signal. The rules published by Bollinger himself say the opposite: tagging a band is neither a buy nor a sell signal (rule 6); in strong trends, price can "walk" along a band for an extended period (rule 7); and the values 20 and 2 are only a starting point, to be adjusted to the market (rule 9).
Full guide: Bollinger Bands: how they work and how to read volatility in crypto.
5. Stochastic
The Stochastic Oscillator was created by George Lane in the late 1950s. It shows where the close sits within the range between the high and the low of the last 14 periods, on a scale from 0 to 100. It has two lines: %K, the faster one, and %D, the 3-period average of %K.
How to read it: above 80, overbought; below 20, oversold. A cross of %K and %D inside those zones is read as a possible reversal. Binance Academy highlights a variant, StochRSI, which applies the same formula to RSI instead of price and uses the 0.8 and 0.2 levels.
Where it fails: it measures almost the same thing as RSI, momentum. Using both together does not give two confirmations; it gives the same information twice. The Stochastic does better in sideways markets. In trends, it gets stuck in the extreme zones and produces many false signals. StochRSI is even more sensitive and, according to Binance Academy itself, produces more false alarms.
Full guide: Stochastic Oscillator: %K, %D, StochRSI and how to read it in crypto.
6. Volume and OBV
Volume is the amount traded in each period. Kraken treats it as one of the four core variables of technical analysis, alongside trend, momentum and volatility. OBV (On-Balance Volume) was introduced by Joe Granville in 1963, in the book Granville's New Key to Stock Market Profits. The math is simple: if the period closes higher, its volume is added to the total; if it closes lower, it is subtracted.
How to read it: a breakout on rising volume has more support than one on weak volume. With OBV, what matters is the direction and shape of the line. If price rises and OBV falls, the rally is happening with less participation (bearish divergence). OBV rising with price confirms the move.
Where it fails: the absolute value of OBV means nothing, and a single volume spike can distort the line for a long time. In crypto, volume is spread across dozens of exchanges: the OBV you see reflects only the platform behind that chart. To go deeper, see Bitcoin beyond price: a guide to reading volume, liquidity and dominance.
Full guide: Volume and OBV: how to read the participation behind price in crypto.
7. Fibonacci retracements
Fibonacci retracement is a drawing tool, not a continuous calculation like the previous ones. You mark a relevant low and high, and it draws horizontal lines at 23.6%, 38.2%, 50%, 61.8% and 78.6% of that move. The 50% level is not a Fibonacci ratio, but it is watched as the midpoint.
How to read it: in an uptrend, the levels show where a pullback may find support; the most watched are 38.2%, 50% and 61.8%. In a downtrend, they show where a bounce may meet resistance.
Where it fails: Binance Academy states that no single level reliably predicts what price will do and that the link between the golden ratio and markets is not scientifically proven. The levels may matter partly because many people watch them. In addition, the result depends on which high and low you choose, and two people can draw different lines on the same chart. Treat the levels as zones, not exact prices.
Full guide: Fibonacci retracement: how to draw the levels and read them in crypto.
How to combine the indicators
The most useful rule comes from John Bollinger: do not combine indicators that measure the same thing. A momentum indicator paired with a volume indicator adds more information than two momentum indicators (rules 3 and 4). In practice, the seven split into four questions:
- What is the trend? Moving averages and MACD.
- Is the move losing strength? RSI or Stochastic. Pick one.
- Is volatility compressed or stretched? Bollinger Bands.
- Is there participation, and where are the price zones? Volume, OBV and Fibonacci.
Kraken also splits indicators into leading ones, which try to anticipate the move (RSI and Stochastic), and lagging ones, which confirm what has already happened (MACD, Bollinger Bands and moving averages). Leading indicators warn early and are wrong more often; lagging ones are wrong less often and arrive late. The same guide warns about "analysis paralysis": too many indicators on screen make the reading worse, not better.
What academic studies found
Three peer-reviewed papers tested technical analysis rules on cryptocurrencies. None of them tests the seven indicators in this list one by one; they all evaluate trading rules, mostly trend-following ones.
| Study | Period and scope | Main result |
|---|---|---|
| Gerritsen, Bouri, Ramezanifar and Roubaud, Finance Research Letters, 2020 | Bitcoin, daily prices from July 2010 to January 2019; seven trend-following indicators | Some rules, mainly the trading range breakout, beat buy-and-hold on the Sharpe ratio, especially in strongly trending markets |
| Grobys, Ahmed and Sapkota, Finance Research Letters, 2020 | The 11 most-traded cryptocurrencies, daily prices from 2016 to 2018; simple moving average strategies | The rule using a 20-day average earned an excess return of 8.76% a year, with Bitcoin excluded from the sample and after adjusting for the average market return |
| Hudson and Urquhart, Annals of Operations Research, 2021 | Two Bitcoin markets and three other cryptocurrencies; almost 15,000 rules from five classes | Predictability and profitability in every class in sample; in the out-of-sample period, Bitcoin showed no predictability |
Sources: paper abstracts in the Utrecht University and RePEc repositories, checked on Oct 11, 2026.
What the data shows and what it does not allow us to conclude
What it shows: simple trend rules did better than buy-and-hold in several past periods of the crypto market, which one of the studies describes as inefficient. The gain showed up mostly in strongly trending markets.
What it does not allow us to conclude:
- That the indicators work today. The samples end between 2018 and 2019, before spot ETFs and the arrival of large institutions.
- That the result holds for Bitcoin. In the Hudson and Urquhart study, Bitcoin's predictability disappeared out of sample, and the 8.76% return from Grobys, Ahmed and Sapkota excludes Bitcoin.
- That RSI, MACD, Bollinger Bands, Stochastic or Fibonacci make money. The studies cited do not evaluate those indicators individually.
- That an ordinary investor would repeat the result. Historical tests leave out execution errors, delays, taxes and the behavior of someone trading under pressure.
An indicator's presence in an exchange's list shows that it is popular. It does not show that it is profitable.
Risks and precautions
- False signals: every indicator gets it wrong, and more often in sideways or illiquid markets.
- Lag: indicators are built from past prices. In fast declines, the signal arrives after the loss.
- Overfitting: tweaking the parameters until the old chart "works" does not improve future results.
- Leverage: trading with leverage on the basis of a line crossover multiplies the loss when the signal fails. In crypto, a position can be liquidated in minutes.
- Liquidity and data: in small coins, a few trades move the price and distort any indicator. One exchange's chart does not represent the whole market.
- Information: technical analysis ignores facts such as a rule change, a security failure or a regulator's decision. Read the context alongside it. See On-chain metrics: four questions before interpreting a chart.
Checklist for beginners
- I can say, in one sentence, what each indicator on my chart measures.
- I use at most one indicator of each type: trend, momentum, volatility and volume.
- I do not treat RSI above 70 or a touch of the Bollinger Band as a sell order.
- I check volume before trusting a breakout.
- I look at the same asset on more than one timeframe, such as daily and weekly.
- I decided how much I accept losing before looking at any signal.
- I do not use leverage to test an indicator I am still learning.
Frequently asked questions
What is the best technical indicator for cryptocurrencies?
There is no single best one. Each indicator answers a different question: trend, momentum, volatility or volume. The material we checked and the creators themselves recommend combining tools of different types, and none of them guarantees results.
Do technical indicators work in crypto?
Academic studies found positive results for trend rules in past periods, up to 2019, but with important caveats: for Bitcoin, predictability did not hold out of sample in one of the studies. Past results do not guarantee future results.
Does RSI above 70 mean the price will fall?
No. It means recent gains were strong relative to losses. In strong trends, RSI can stay above 70 for a long time while price keeps rising.
How many indicators should I use at once?
A few, of different types. RSI and Stochastic measure almost the same thing, so using both adds no confirmation. Kraken warns that too many indicators lead to "analysis paralysis".
What is the difference between technical and fundamental analysis?
Technical analysis studies price and volume to read market behavior. Fundamental analysis studies the project: usage, revenue, token issuance, team and risks. One does not replace the other.
Do the indicators work for any cryptocurrency?
The math works on any chart, but reliability drops in illiquid coins, where a few trades move the price and volume is easy to distort.
Informational and educational content. It is not an investment recommendation, an offer or a solicitation to buy or sell assets.
Sources: Binance Academy — five essential indicators used in technical analysis (updated Jun 18, 2026); Kraken Learn — crypto technical indicators (Dec 30, 2025); IG — ten trading indicators; StockCharts ChartSchool — moving averages; StockCharts ChartSchool — RSI; StockCharts ChartSchool — MACD; StockCharts ChartSchool — Stochastic Oscillator; StockCharts ChartSchool — OBV; John Bollinger — Bollinger Band rules; Binance Academy — Fibonacci retracement (updated Jun 25, 2026); Gerritsen et al. — The profitability of technical trading rules in the Bitcoin market (2020); Grobys, Ahmed and Sapkota — Technical trading rules in the cryptocurrency market (2020); Hudson and Urquhart — Technical trading and cryptocurrencies (2021). Checked on Oct 11, 2026.
Articles in this topic: Technical analysis
This guide is the main page for the topic. The articles below go deeper into each part.
- Moving averages in crypto: SMA, EMA, crossovers and limits
- RSI: how the Relative Strength Index works and how to read it in crypto
- MACD: how it works, how to read crossovers and where it fails
- Bollinger Bands: how they work and how to read volatility in crypto
- Stochastic Oscillator: %K, %D, StochRSI and how to read it in crypto
- Volume and OBV: how to read the participation behind price in crypto
- Fibonacci retracement: how to draw the levels and read them in crypto
- How to make good crypto trades: plan, risk and discipline in every trade
Read more
- Altcoin season in 2026: 7 indicators to identify the season
- Bitcoin beyond price: a guide to reading volume, liquidity and dominance
- On-chain metrics: four questions before interpreting a chart
- Altcoin season: how to identify it and understand the risks
- Bitcoin price history: cycles and maximum drawdowns
- What a market dashboard shows — and what it still cannot answer
A sound market reading combines data, context and clear risk limits.