
Moving averages in crypto: SMA, EMA, crossovers and limits
How simple and exponential moving averages work, with a worked example, how to read crossovers, the most used periods, what changes in crypto and the limits of the indicator.
Quick answer
A moving average is the average price over the last N periods, recalculated with each new candle. It predicts nothing: it smooths out noise and shows the direction of the trend. The two most used versions are the simple (SMA), which gives every period the same weight, and the exponential (EMA), which weights recent prices more heavily. The most common readings are where price sits relative to the average, the crossover between two averages, and the average as a support or resistance zone.
This guide is part of the series on the seven most cited technical indicators. It explains the calculation, the signals, the settings and the limits. There is no buy or sell recommendation.
How a moving average is calculated
Simple moving average (SMA)
Add the closes of the last N periods and divide by N. An illustrative example with five closes: 100, 102, 104, 103 and 106. The sum is 515, and the 5-period SMA is 103. In the next period, the oldest price drops out and the new one comes in.
Exponential moving average (EMA)
The EMA applies a multiplier to the most recent price: 2 ÷ (N + 1). For 5 periods, the multiplier is 0.333. The formula is: today's EMA = (close − yesterday's EMA) × multiplier + yesterday's EMA. The first value in the series is usually an SMA.
Continuing the example: if yesterday's EMA was 103 and price closes at 109, today's EMA is (109 − 103) × 0.333 + 103 = 105.0. The SMA of the same five periods (102, 104, 103, 106 and 109) would be 104.8. The gap is small, but it shows the rule: the EMA reacts sooner.
| Feature | SMA | EMA |
|---|---|---|
| Weight of each period | Equal for all | Higher for recent ones |
| Reaction speed | Slower | Faster |
| False signals | Fewer, but later | More, but earlier |
| Most common use | Long-term reference and support zones | Short-term reading and the basis of other indicators, such as MACD |
Source: StockCharts ChartSchool, checked on Oct 11, 2026. One practical detail: because each EMA value depends on all the previous ones, it needs far more data than its period to be accurate. On a newly listed coin, the 200-period EMA is not yet reliable.
Which periods to use
There is no correct period. StockCharts groups the lengths like this: 5 to 20 periods for the short term, 20 to 60 for the medium term and 100 or more for the long term. The 200-period average is the most popular long-term reference, and the 50-period one is the medium-term reference. The longer the average, the smoother and the more lagging it is.
How to read it
Price position and slope
Price above a rising long average suggests an uptrend. Price below a falling average suggests a downtrend. The slope matters as much as the position: a flat 200-period average points to a market without direction.
Price crossover
The simplest signal is price crossing the average: upward, a bullish reading; downward, a bearish one. It is fast and produces many false signals.
Double crossover
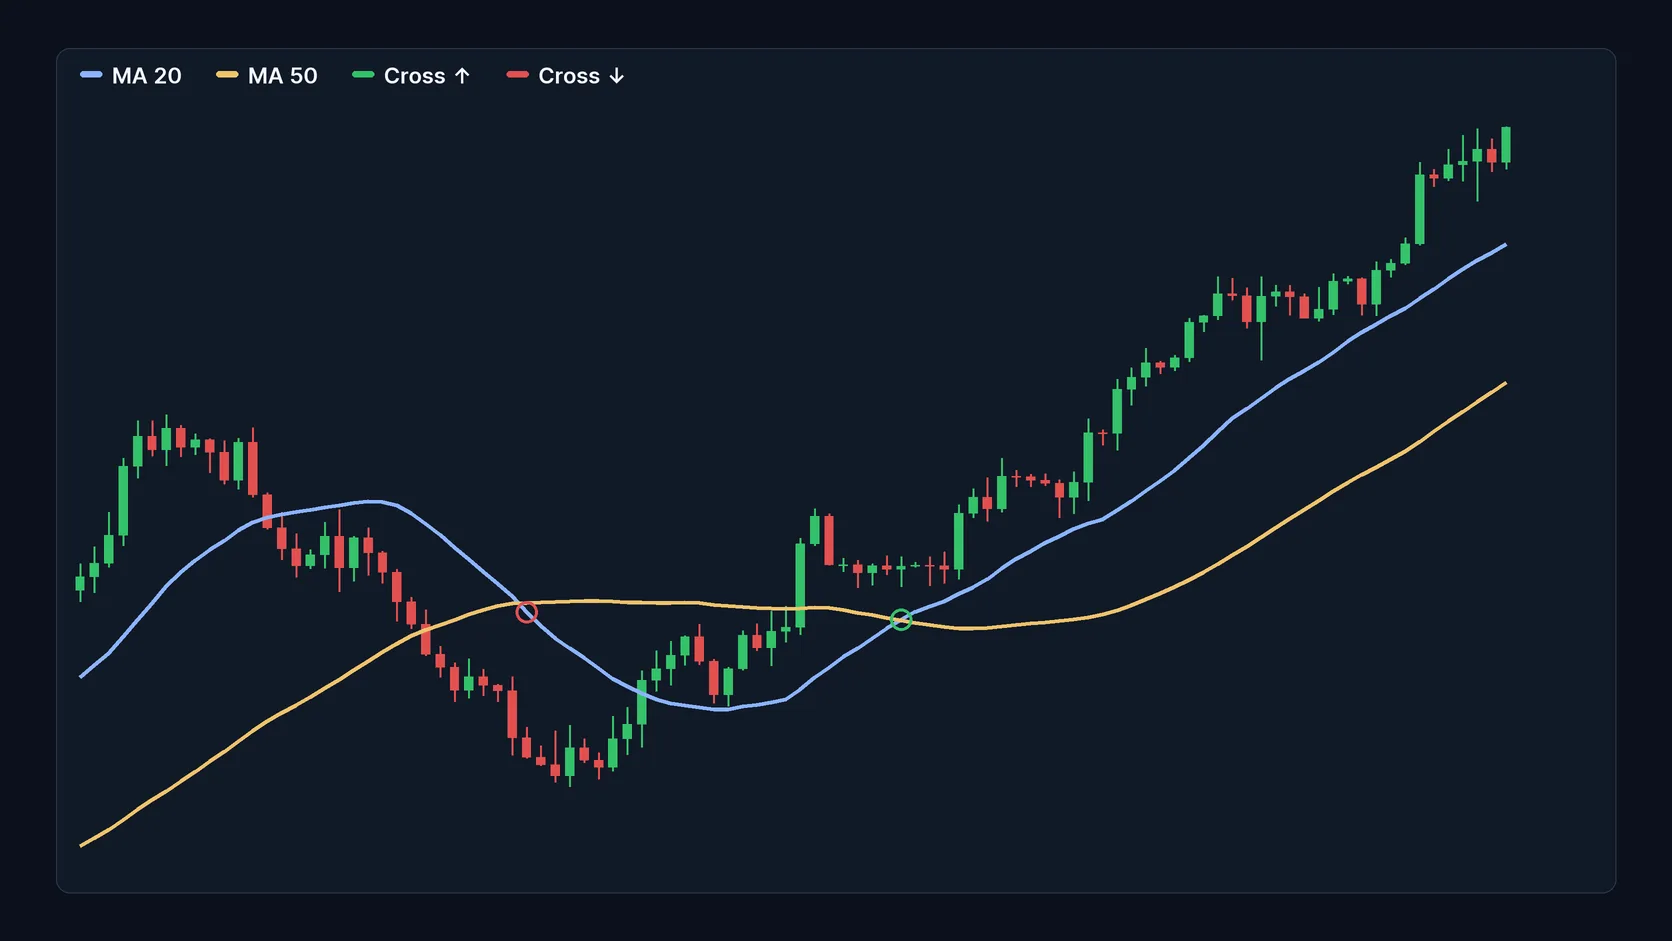
This uses a short and a long average. When the short one crosses above the long one, the market calls it a golden cross, usually with the 50 and 200-period averages. Crossing below is a death cross. These crossovers are late by construction: by the time they show up, much of the move has already happened.
Support and resistance
In uptrends, price often pulls back to an average and then rises again; in downtrends, the opposite. Treat the average as an approximate zone, not an exact price.
What changes in crypto
- A 24-hour market: there is no official close. The "daily close" is a platform convention, so the same average can differ slightly from one chart to another.
- High volatility: large swings within a few hours make price cross short averages several times. Short averages on short timeframes produce a lot of noise.
- Short history: new coins do not have enough data for long averages.
- Collective attention: Bitcoin's 50 and 200-day averages are watched by many people, which explains part of the reactions around them. That does not make them forecasts.
Where the moving average fails
The moving average is a lagging indicator. It confirms a trend that has already started and does not catch tops or bottoms. In a sideways market, crossovers multiply and most of them are false. StockCharts sums it up: it works well in strong trends and is ineffective in trading ranges.
There is one piece of academic evidence worth knowing, with its limits. A study by Grobys, Ahmed and Sapkota (Finance Research Letters, 2020) tested simple moving average strategies on the 11 most-traded cryptocurrencies, using daily prices from 2016 to 2018. The rule with a 20-day average earned an excess return of 8.76% a year, with Bitcoin excluded from the sample. The period is short and old, and the result does not include Bitcoin: it is no promise of results today.
Risks and precautions
- Late signal: in fast declines, the crossover arrives after the loss.
- Strings of false signals: in a sideways market, following every crossover piles up small losses and fees.
- Overfitting: changing the period until the old chart "works" does not improve future results.
- Leverage: trading with leverage on a crossover multiplies the loss when the signal fails.
- Liquidity: in small coins, a few trades move the price and distort the average.
Checklist for beginners
- I know whether I am looking at an SMA or an EMA, and which period.
- I look at the slope of the average, not only the crossover.
- I check whether the market is trending or sideways before giving weight to a crossover.
- I compare the same asset on more than one timeframe, such as daily and weekly.
- I confirm the signal with volume or with another type of indicator.
Frequently asked questions
Which is better, SMA or EMA?
Neither is better at everything. The EMA reacts faster and is wrong more often; the SMA is slower and steadier. Many analysts use the SMA for long references and the EMA for the short term.
Does a golden cross guarantee a rally?
No. It is a lagging signal confirming that the short average has moved above the long one. It appears in real trends and also in false starts, especially in sideways markets.
Which moving average period should I use for cryptocurrencies?
It depends on the timeframe you watch. The most followed are 20, 50 and 200 periods. More important than the number is using the same criterion consistently and understanding each average's lag.
Do moving averages work on minute charts?
The math works on any timeframe, but the shorter the timeframe, the more noise and false signals.
Informational and educational content. It is not an investment recommendation, an offer or a solicitation to buy or sell assets.
Sources: StockCharts ChartSchool — simple and exponential moving averages; Binance Academy — five essential indicators used in technical analysis (updated Jun 18, 2026); Kraken Learn — crypto technical indicators (Dec 30, 2025); Grobys, Ahmed and Sapkota — Technical trading rules in the cryptocurrency market (2020). Checked on Oct 11, 2026.
Read more
- Technical indicators in crypto: the 7 most cited by experts and how to read each one
- MACD: how it works, how to read crossovers and where it fails
- Bollinger Bands: how they work and how to read volatility in crypto
- Bitcoin price history: cycles and maximum drawdowns
- What a market dashboard shows — and what it still cannot answer
- Altcoin season: how to identify it and understand the risks
A sound market reading combines data, context and clear risk limits.