
Bollinger Bands: how they work and how to read volatility in crypto
How Bollinger Bands are calculated, what the squeeze, the tag and walking the bands mean, the rules published by John Bollinger and why a tag is not a signal.
Quick answer
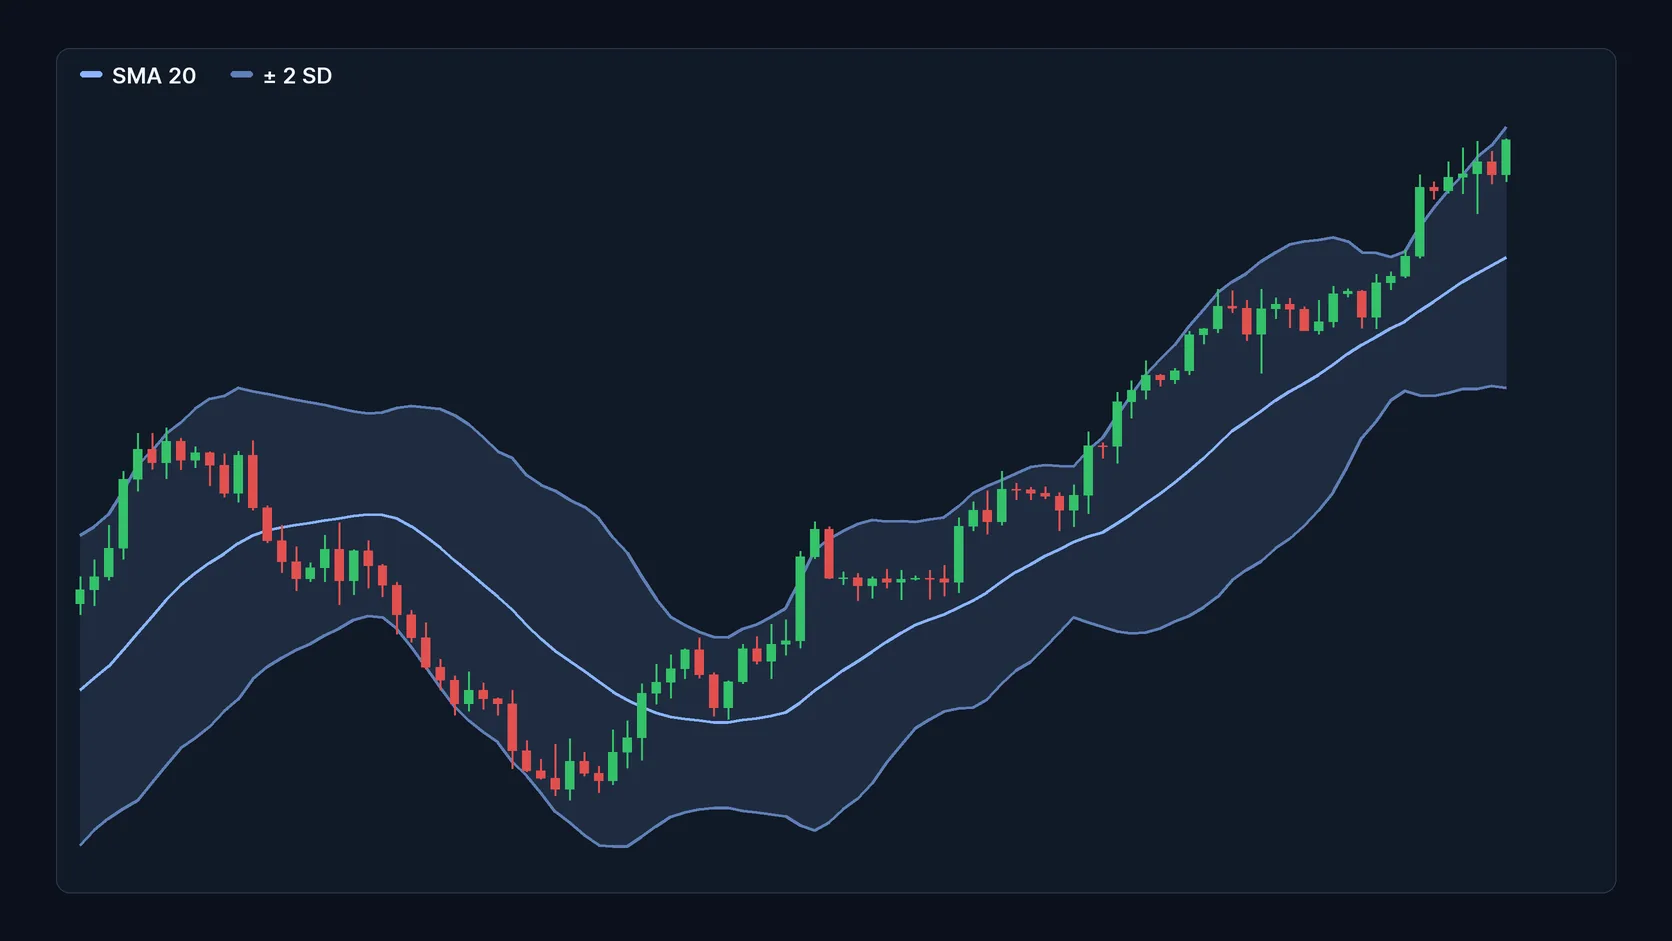
Bollinger Bands are three lines drawn over price: a 20-period simple moving average in the middle and two bands 2 standard deviations away, one above and one below. They show two things: whether price is high or low relative to its recent behavior and whether volatility is rising or falling. Touching a band is neither a buy nor a sell signal.
This guide is part of the series on the seven most cited technical indicators. It explains the calculation, the signals and the limits. There is no buy or sell recommendation.
Where they come from
The bands were developed by analyst John Bollinger, and the name is his registered trademark. The core idea is that "high" and "low" are not fixed values: they depend on current volatility. That is why the bands widen when the market gets agitated and narrow when it calms down.
How the bands are calculated
- Middle band: a 20-period simple moving average.
- Upper band: the middle band plus 2 times the standard deviation of the same 20 periods.
- Lower band: the middle band minus 2 times the standard deviation.
Standard deviation measures how far prices stray from the average. An illustrative example: if the 20-period average is 100 and the standard deviation is 4, the upper band sits at 108 and the lower one at 92. If volatility drops and the standard deviation goes to 1, the bands move to 102 and 98, even with the average in the same place.
According to Bollinger, as cited by StockCharts, the bands should contain about 88% to 89% of price action. That is why a close outside them draws attention, without being a signal by itself.
How to read them
Relative price
Bollinger's rule 1 defines what the bands are for: near the upper band, price is relatively high; near the lower band, relatively low. "Relatively high" does not mean "about to fall", and "relatively low" does not mean "about to rise".
The squeeze
When the bands narrow sharply, the market calls it a squeeze. It is a period of compressed volatility, which often comes before a larger move. Binance Academy stresses the limit: the direction of that move is not known in advance. The distance between the bands is tracked by a derived indicator, BandWidth.
Walking the bands
In strong trends, price can touch the upper band repeatedly while it keeps rising, or the lower band while it keeps falling. Bollinger's rule 7 covers this: hugging a band does not mean the trend is over. At those times, the middle band often acts as support or resistance.
W-bottoms and M-tops
Bollinger uses the bands to confirm reversal patterns. In a W-bottom, price makes a first low near or below the lower band, bounces, and makes a second low that holds inside the band; confirmation comes with a break of resistance. The M-top is the reverse and is usually more drawn out and irregular.
| Bollinger's rule | What it says |
|---|---|
| Rule 1 | The bands define high and low on a relative basis |
| Rules 3 and 4 | Combine with indicators of other types, without repeating the same measure |
| Rule 6 | A tag of the band is just a tag, not a signal |
| Rule 7 | In strong trends, price can walk along the band |
| Rule 9 | The values 20 and 2 are a starting point, to be adjusted to the market |
Source: rules published by John Bollinger at bollingerbands.com, checked on Oct 11, 2026. Wording summarized.
Settings
The default is 20 periods and 2 standard deviations. Bollinger recommends small adjustments to the multiplier when the period changes: 1.9 for a 10-period average and 2.1 for a 50-period one. Shorter periods make the bands jumpier; longer ones make them slower.
What changes in crypto
- Wide bands: crypto volatility tends to keep the bands wide open. A price "inside the bands" can still mean a large percentage swing.
- Trends with repeated tags: in strong rallies and declines, price walks along the band for a long time. Trading against the band at those times is a common mistake.
- Squeezes followed by sharp moves: after calm periods, the exit from a squeeze can be fast, in either direction.
- Wicks: the bands use closing prices. A wick that pierces the band during the candle does not change the reading by itself.
Where the bands fail
The bands do not give direction. They describe volatility and relative position, and Kraken classifies them as a lagging indicator. StockCharts itself warns that they should not be used alone. The classic mistake is treating a tag as a signal, which the creator's own rules contradict.
To confirm the reading, Bollinger suggests indicators of a different nature, such as volume or momentum. See the guides to volume and OBV and to RSI.
Risks and precautions
- Selling at the upper tag: in an uptrend, price can keep rising glued to the band.
- Buying at the lower tag: in a downtrend, price can keep falling glued to the band.
- Betting on the squeeze's direction: the squeeze warns that volatility may return, not which way.
- Leverage: the exit from a squeeze can be violent and liquidate leveraged positions on both sides.
- Liquidity: in small coins, a single large trade widens the bands artificially.
Checklist for beginners
- I know the middle band is a 20-period average.
- I do not treat a tag of the band as an order.
- I identify the trend before interpreting where price sits.
- Facing a squeeze, I wait for price to show the direction.
- I confirm with volume or with a momentum indicator.
Frequently asked questions
Is price outside the Bollinger Band a reversal signal?
Not necessarily. It shows a strong move relative to recent volatility. In strong trends, price can stay against or outside the band for several periods.
What is the Bollinger Band squeeze?
It is the narrowing of the bands when volatility falls. It often comes before a larger move, but it does not indicate the direction.
Which settings should I use?
The default is 20 periods and 2 standard deviations. Bollinger himself says they are a starting point and suggests small adjustments depending on the period.
Do Bollinger Bands work alone?
That is not the creator's recommendation. He suggests combining them with indicators of another type, such as volume and momentum.
Informational and educational content. It is not an investment recommendation, an offer or a solicitation to buy or sell assets.
Sources: John Bollinger — Bollinger Band rules; StockCharts ChartSchool — Bollinger Bands; Binance Academy — five essential indicators used in technical analysis (updated Jun 18, 2026); Kraken Learn — crypto technical indicators (Dec 30, 2025). Checked on Oct 11, 2026.
Read more
- Technical indicators in crypto: the 7 most cited by experts and how to read each one
- Moving averages in crypto: SMA, EMA, crossovers and limits
- Volume and OBV: how to read the participation behind price in crypto
- RSI: how the Relative Strength Index works and how to read it in crypto
- What a market dashboard shows — and what it still cannot answer
- Market capitalization: what it measures and what it leaves out
A sound market reading combines data, context and clear risk limits.