
Fibonacci retracement: how to draw the levels and read them in crypto
Where the Fibonacci levels come from, how to draw the retracement, a worked example, how to read zones and confluence, and why no level reliably predicts price.
Quick answer
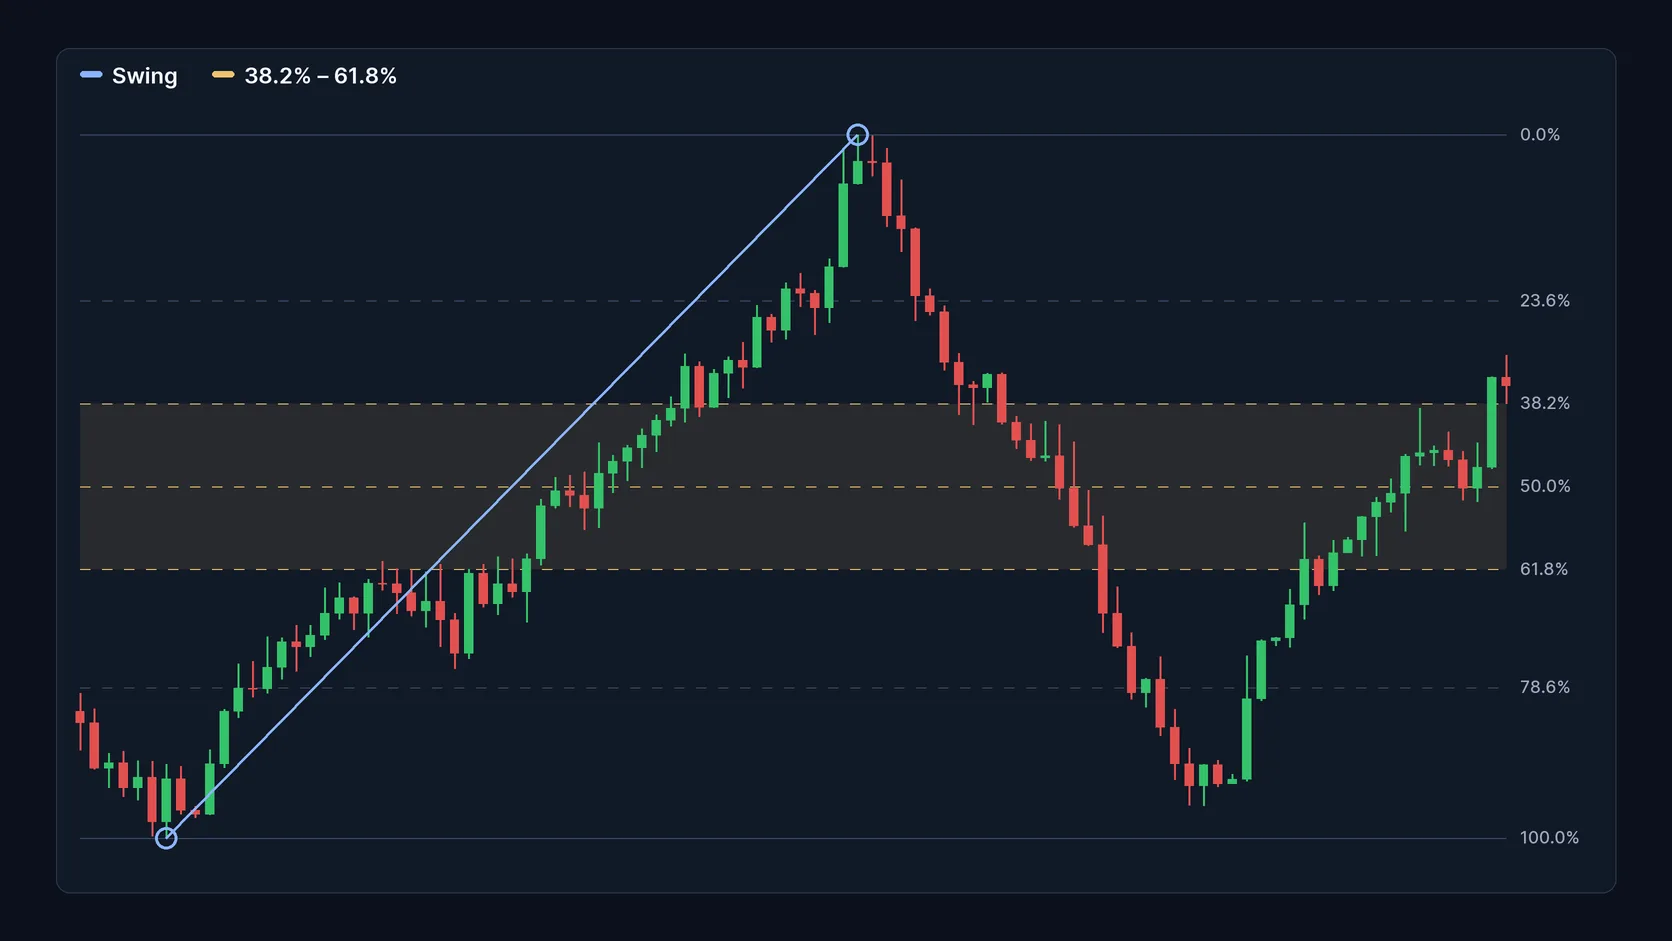
Fibonacci retracement is a drawing tool. You mark a relevant low and high on the chart, and it draws horizontal lines at fixed percentages of that move: 23.6%, 38.2%, 50%, 61.8% and 78.6%. Those lines mark zones where a pullback may find support, or where a bounce may meet resistance. They do not predict price: they are areas of attention, and the very guides that teach them say no level is reliable by itself.
This guide is part of the series on the seven most cited technical indicators. It explains where the levels come from, how to draw them and what the limits are. There is no buy or sell recommendation.
Where the numbers come from
The name comes from Leonardo of Pisa (1170–1250), the Italian mathematician known as Fibonacci, who is credited with introducing the sequence to the West. In the sequence, each number is the sum of the two before it: 0, 1, 1, 2, 3, 5, 8, 13, 21, 34, 55, 89, 144 and so on.
The percentages come from dividing numbers in the sequence:
| Level | Origin | Usual reading |
|---|---|---|
| 23.6% | A number divided by the one three places ahead | Shallow pullback |
| 38.2% | A number divided by the one two places ahead | Moderate pullback |
| 50% | Not a Fibonacci ratio; it comes from the idea that markets often give back half of a move | Moderate pullback |
| 61.8% | A number divided by the next one; the so-called golden ratio | Deep pullback |
| 78.6% | The square root of 0.618 | Very deep pullback |
Sources: StockCharts ChartSchool and Binance Academy, checked on Oct 11, 2026. The Dow Theory origin of the 50% level is the explanation given by StockCharts.
How to draw it
- In an uptrend: mark the low where the move started and the high where it stopped. The lines sit between the two and show where the pullback may find support.
- In a downtrend: mark from the high to the low. The lines show where a bounce may meet resistance.
An illustrative example: an asset rises from 100 to 200. The 23.6% retracement sits at 176.4; 38.2% at 161.8; 50% at 150; 61.8% at 138.2; and 78.6% at 121.4. The math is: the high minus the percentage times the size of the move. For 38.2%: 200 − 0.382 × 100 = 161.8.
How to read it
Zones, not lines
Both StockCharts and Binance Academy treat the levels as alert zones, not exact turning points. The most watched are 38.2%, 50% and 61.8%.
Depth of the pullback
A pullback that stops at 23.6% is shallow and suggests a strong trend. Between 38.2% and 50%, it is moderate. At 61.8%, it is deep.
Confluence
A level gains weight when it lines up with another reference: a moving average, a previous support, a rise in volume or a momentum reading. The more factors point to the same zone, the more robust the reading. Even so, there is no guarantee.
Extensions
Binance Academy also mentions levels beyond 100%, such as 161.8%, 261.8% and 423.6%, used as projections of how far a move may go. The same limits as retracements apply.
What changes in crypto
- Deep pullbacks are common: volatility makes price cut through several levels in a short time. A pause at 61.8% can last hours and then give way.
- Wicks: extreme highs and lows, common in illiquid coins, change the reference high and low. Drawing from the wick or from the close gives different lines.
- Different prices across exchanges: the exact high and low vary from one platform to another, and so do the levels.
- Collective attention: in widely followed assets, such as Bitcoin, many people draw the same levels, which helps explain reactions around them.
Where Fibonacci retracement fails
Binance Academy is direct: no single level reliably predicts what price will do, and the link between the golden ratio and markets is not scientifically proven. The levels may matter partly because many traders watch them.
There is also a problem of method. The result depends on which high and low you choose, and two people can draw different lines on the same chart. With five levels between the high and the low, almost every pullback stops "near" one of them, which makes it easy to see hits after the fact. None of the three academic studies cited in the main article evaluates Fibonacci retracements.
Risks and precautions
- Treating a level as a floor: buying at 61.8% without confirmation is betting that the decline ends there.
- Fitting the drawing to the result: moving the high and low until the lines "fit" has no predictive value.
- A stop that is too tight: in crypto, price often pierces the level slightly before reacting, or not reacting.
- Leverage: a pullback that cuts through the expected level can liquidate leveraged positions.
- Liquidity: in small coins, the levels mean even less.
Checklist for beginners
- I chose a clear high and low that someone else would also mark.
- I treat the levels as zones, not exact prices.
- I look for confluence with a moving average, a previous support or volume.
- I wait for price to react before giving weight to a level.
- I decided how much I accept losing if the level breaks.
Frequently asked questions
Which Fibonacci level matters most?
The most watched are 38.2%, 50% and 61.8%. None is reliable by itself, and its importance depends on context and on confirmation from other tools.
Is the 50% level a Fibonacci level?
No. It does not come from the sequence. It is included because markets often give back about half of a move, an idea associated with Dow Theory.
Does Fibonacci retracement have a scientific basis?
There is no scientific proof of the link between the golden ratio and markets, as Binance Academy itself acknowledges. The levels may work partly because many people watch them.
Should I draw from the wicks or from the closes?
There is no single rule. What matters is using the same criterion consistently and remembering that the levels are approximate zones.
Informational and educational content. It is not an investment recommendation, an offer or a solicitation to buy or sell assets.
Sources: StockCharts ChartSchool — Fibonacci retracements; Binance Academy — Fibonacci retracement (updated Jun 25, 2026); Kraken Learn — crypto technical indicators (Dec 30, 2025). Checked on Oct 11, 2026.
Read more
- Technical indicators in crypto: the 7 most cited by experts and how to read each one
- Moving averages in crypto: SMA, EMA, crossovers and limits
- Volume and OBV: how to read the participation behind price in crypto
- Bitcoin price history: cycles and maximum drawdowns
- Altcoin season: how to identify it and understand the risks
- What a market dashboard shows — and what it still cannot answer
A sound market reading combines data, context and clear risk limits.