
MACD: how it works, how to read crossovers and where it fails
What MACD is, how the MACD line, signal line and histogram are calculated, how to read crossovers and divergences, and why the indicator lags and fails in sideways markets.
Quick answer
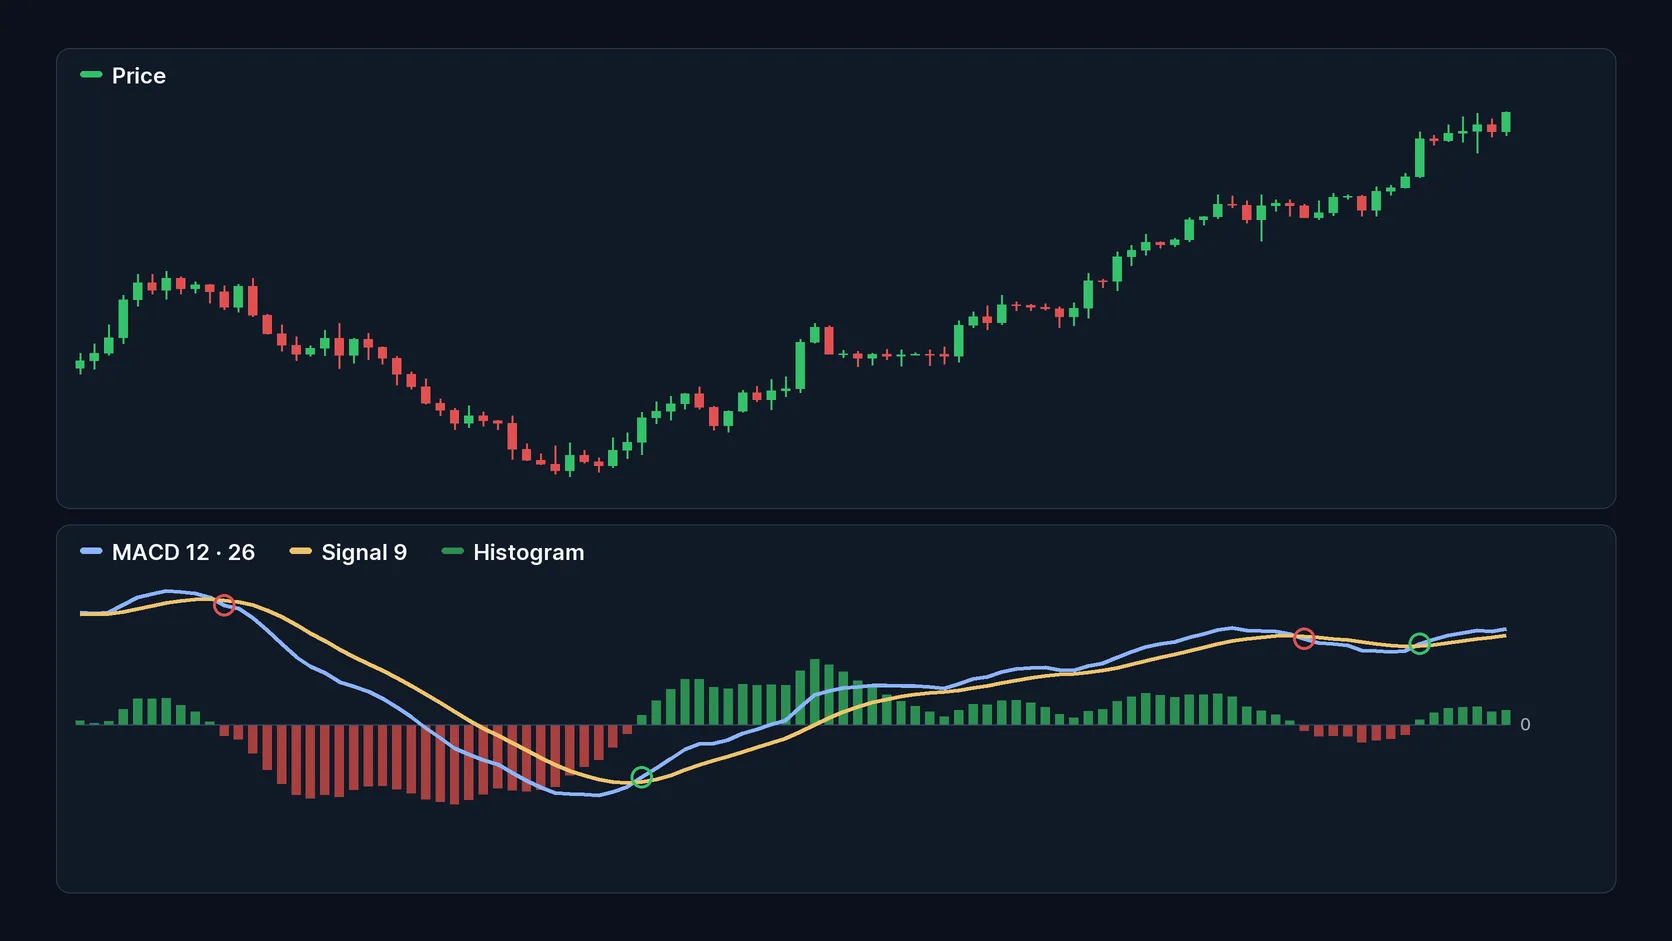
MACD (Moving Average Convergence Divergence) shows the distance between two exponential averages of price. When the short average moves away from the long one, the trend's momentum is increasing; when it moves closer, momentum is fading. It has three parts: the MACD line, the signal line and the histogram. The default settings are 12, 26 and 9.
This guide is part of the series on the seven most cited technical indicators. It explains the calculation, the signals and the limits. There is no buy or sell recommendation.
Where it comes from
MACD was developed by Gerald Appel in the late 1970s. The histogram was added later by Thomas Aspray, to anticipate crossovers between the two lines. The indicator combines two ideas: it follows the trend, because it is built from averages, and it measures momentum, because it watches how fast they move apart.
How MACD is calculated
- MACD line: the 12-period exponential average minus the 26-period one.
- Signal line: the 9-period exponential average of the MACD line itself.
- Histogram: the MACD line minus the signal line.
An illustrative example: if the 12-period average is at 105 and the 26-period one at 102, the MACD line is 3. If the signal line is at 2.2, the histogram is 0.8. A positive, growing histogram means the MACD line is pulling away above the signal line.
To understand the averages behind the indicator, see the guide to moving averages.
How to read it
Signal line crossover
This is the most common signal. The MACD line crossing above the signal line points to upward momentum gaining strength; crossing below, downward momentum. It is also the most frequent signal and the one that fails most in sideways markets.
Zero line crossover
When the MACD line moves from negative to positive, the 12-period average has moved above the 26-period one. It is a slower, less frequent signal than the signal line crossover.
Divergences
In a bullish divergence, price makes a lower low and MACD makes a higher low. In a bearish one, price makes a higher high and MACD makes a lower high. Both suggest that momentum is weakening.
Histogram
The histogram shrinks before the lines cross, which is why it is used to anticipate the crossover. StockCharts points out the cost: it is four steps removed from price, an indicator of an indicator, and short, shallow divergences are frequent and unreliable.
| Signal | What it indicates | Speed | Main limit |
|---|---|---|---|
| Shrinking histogram | The lines are converging | Fastest | Many false signals |
| Signal line crossover | A shift in momentum | Intermediate | Fails in sideways markets |
| Zero line crossover | The short average passed the long one | Slowest | Arrives after much of the move |
| Divergence | Momentum is weakening | Variable | Can repeat without a reversal |
Source: StockCharts ChartSchool, checked on Oct 11, 2026.
Settings
The 12, 26 and 9 default is the most widely used, and both Binance Academy and StockCharts use it as the reference. Smaller settings make MACD faster and more prone to false signals; larger ones make it slower. Changing the numbers until the old chart "works" does not improve future results.
What changes in crypto
- Values are not comparable: MACD is calculated in price units. The MACD of Bitcoin, which trades in the tens of thousands of dollars, cannot be compared with that of a coin worth cents. To compare assets, StockCharts points to the percentage version, called PPO.
- Sharp moves: in very fast rallies or declines, MACD stretches a lot. Because it has no upper or lower bound, there is no reliable "overbought zone".
- A 24-hour market: the candle close is a platform convention, and crossovers can appear at slightly different moments from one chart to another.
Where MACD fails
MACD is built from averages, so it lags. Kraken classifies it as a lagging indicator: it confirms what has already happened and is weak at anticipating. In a sideways market, the lines cross repeatedly while price goes nowhere. And because it is unbounded, it is not well suited to identifying overbought and oversold conditions; that is what oscillators such as RSI are for.
Risks and precautions
- Late entry: the crossover can arrive when the move is close to its end.
- Strings of signals: in a sideways market, following every crossover piles up small losses and fees.
- Anticipating with the histogram: acting before the crossover raises the chance of error.
- Leverage: a crossover that fails, on a leveraged position, multiplies the loss.
- Liquidity: in small coins, a few trades move the price and produce meaningless crossovers.
Checklist for beginners
- I can identify the MACD line, the signal line and the histogram.
- I check whether the market is trending before giving weight to a crossover.
- I do not use MACD to decide whether something is "expensive" or "cheap".
- I do not compare MACD values between coins with very different prices.
- I confirm the signal with volume or with an indicator of another type.
Frequently asked questions
What does a positive MACD mean?
That the 12-period exponential average is above the 26-period one. It indicates that recent prices are, on average, above the prices of a longer period.
Do MACD and RSI measure the same thing?
Not exactly. MACD combines trend and momentum and is unbounded. RSI measures the strength of recent gains and losses on a scale from 0 to 100. That is why they are often used together.
What is the MACD histogram for?
It shows the distance between the MACD line and the signal line. When it shrinks, the lines are getting closer, which can come before a crossover.
Does MACD work on any timeframe?
The math does. Reliability drops on very short timeframes, where noise dominates.
Informational and educational content. It is not an investment recommendation, an offer or a solicitation to buy or sell assets.
Sources: StockCharts ChartSchool — MACD; StockCharts ChartSchool — MACD histogram; Binance Academy — five essential indicators used in technical analysis (updated Jun 18, 2026); Kraken Learn — crypto technical indicators (Dec 30, 2025). Checked on Oct 11, 2026.
Read more
- Technical indicators in crypto: the 7 most cited by experts and how to read each one
- Moving averages in crypto: SMA, EMA, crossovers and limits
- RSI: how the Relative Strength Index works and how to read it in crypto
- Volume and OBV: how to read the participation behind price in crypto
- How to read the crypto market today: price, volume and dominance
- Altcoin season: how to identify it and understand the risks
A sound market reading combines data, context and clear risk limits.