
RSI: how the Relative Strength Index works and how to read it in crypto
What RSI is, how it is calculated, what the 70 and 30 levels mean, divergences, failure swings, ranges by market type and why overbought is not a sell signal.
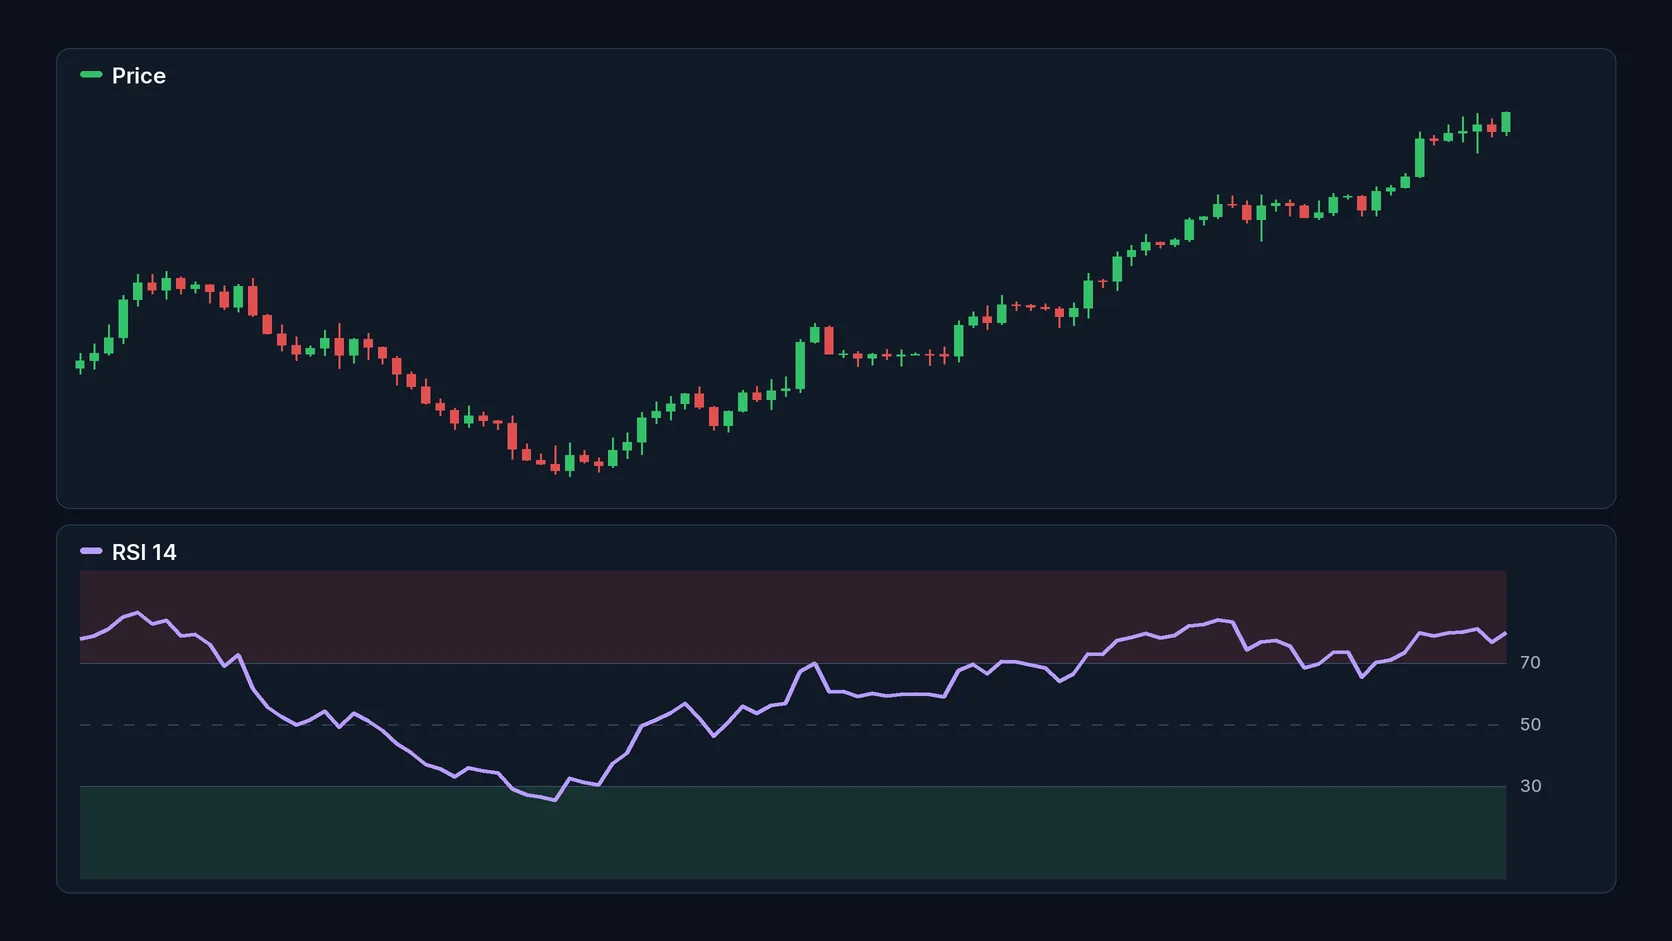
Quick answer
RSI (Relative Strength Index) compares the size of recent gains with the size of recent losses and returns a number from 0 to 100. Above 70, the asset is considered overbought; below 30, oversold. The default is 14 periods. RSI measures the strength of the move, not the asset's fair value: "overbought" does not mean "about to fall".
This guide is part of the series on the seven most cited technical indicators. It explains the calculation, the signals and the limits. There is no buy or sell recommendation.
Where it comes from
RSI was created by J. Welles Wilder and published in 1978 in the book New Concepts in Technical Trading Systems. Despite the name, it does not compare one asset with another: it measures the asset's strength relative to its own recent history.
How RSI is calculated
The calculation has three steps:
- Average gain and average loss: over the first 14 periods, add up the gains and divide by 14; do the same with the losses, treated as positive values.
- Relative strength (RS): divide the average gain by the average loss.
- RSI: 100 − 100 ÷ (1 + RS).
An illustrative example: if the average gain is 1.5 and the average loss is 0.5, RS is 3 and RSI is 100 − 100 ÷ 4 = 75. If the average gain and loss are equal, RS is 1 and RSI is 50.
After the first value, Wilder uses smoothing: average gain = (previous average gain × 13 + current gain) ÷ 14, and the same for the loss. Because of that smoothing, RSI needs plenty of history to settle. StockCharts uses at least 250 periods of data; on a newly listed coin, the RSI of the first days is worth little.
How to read it
Overbought and oversold
The best-known reading uses the 70 and 30 levels. According to StockCharts, these signals work best when price moves sideways, in a range. In strong trends, RSI can stay above 70 or below 30 for a long time.
Divergences
In a bearish divergence, price makes a higher high and RSI makes a lower high. In a bullish divergence, price makes a lower low and RSI makes a higher low. Both suggest fading strength. Wilder considered them more reliable after an overbought or oversold reading. The limit is well known: a firm rally can show several bearish divergences before any top.
Failure swings
Wilder described the failure swing, a signal that depends only on RSI. In the bullish version, RSI drops below 30, bounces, pulls back without going below 30 again and then breaks its previous peak. The bearish version is the mirror image around 70.
Ranges by market type
Analyst Constance Brown observed that the ranges shift with the trend. In bull markets, RSI tends to move between 40 and 90, with the 40 to 50 zone acting as support. In bear markets, it tends to move between 10 and 60, with the 50 to 60 zone acting as resistance. This reading helps explain why RSI rarely reaches 30 in a strong rally.
| Reading | What it suggests | Limit |
|---|---|---|
| Above 70 | Strong recent gains | Can last for weeks in an uptrend |
| Below 30 | Strong recent losses | Can last for weeks in a downtrend |
| Divergence | The move is losing strength | Shows up several times before a real reversal |
| The 50 line | Balance between gains and losses | Crossed many times in sideways markets |
Source: StockCharts ChartSchool, checked on Oct 11, 2026.
Settings
The default is 14 periods. A shorter RSI, such as 10, is more sensitive and reaches the extreme levels more often. A longer one, such as 20, is smoother and rarely gets there. The levels can also be adjusted, for example to 80 and 20 on very volatile assets. Any adjustment trades sensitivity for false signals.
What changes in crypto
- Long trends: cryptocurrencies tend to have strong, extended moves. Selling only because RSI went above 70 is a common mistake.
- Volatility: volatile assets reach the extreme levels more easily, which lowers the value of each signal.
- Short timeframes: on minute charts, RSI touches 70 and 30 many times a day.
- New coins: with little history, the calculation has not settled yet.
Where RSI fails
RSI is a leading indicator: it tries to warn early and is therefore wrong more often. Kraken notes that many divergences appear before simple pauses in strong trends, not before reversals. In addition, RSI measures the same dimension as the Stochastic, momentum. Using both together repeats the information instead of confirming it.
Risks and precautions
- Isolated signal: an extreme RSI without confirmation from price, volume or trend is only an observation.
- Trading against the trend: buying every RSI below 30 in a bear market piles up losses.
- Leverage: a divergence that fails, on a leveraged position, can lead to liquidation in minutes.
- Liquidity: in thinly traded coins, a single candle distorts RSI.
Checklist for beginners
- I know RSI measures the strength of the move, not fair value.
- I identify the trend before interpreting 70 and 30.
- I do not treat a divergence as a buy or sell order.
- I use RSI or Stochastic, not both as if they were different confirmations.
- I confirm the reading with a trend or volume indicator.
Frequently asked questions
Is RSI above 70 a sell signal?
Not by itself. It shows that recent gains were strong. In uptrends, RSI can stay above 70 for a long time while price keeps rising.
What is the best period for RSI?
Wilder's default is 14. Shorter periods give more signals and more errors; longer ones give fewer signals and more lag.
What is an RSI divergence?
It is when price and RSI point in different directions: price makes a new high and RSI does not, or price makes a new low and RSI does not. It suggests fading strength without guaranteeing a reversal.
What is the difference between RSI and StochRSI?
StochRSI applies the Stochastic formula to RSI itself. It is more sensitive and produces more false signals.
Informational and educational content. It is not an investment recommendation, an offer or a solicitation to buy or sell assets.
Sources: StockCharts ChartSchool — RSI; Binance Academy — five essential indicators used in technical analysis (updated Jun 18, 2026); Kraken Learn — crypto technical indicators (Dec 30, 2025). Checked on Oct 11, 2026.
Read more
- Technical indicators in crypto: the 7 most cited by experts and how to read each one
- Stochastic Oscillator: %K, %D, StochRSI and how to read it in crypto
- MACD: how it works, how to read crossovers and where it fails
- Altcoin season in 2026: 7 indicators to identify the season
- What a market dashboard shows — and what it still cannot answer
- How to read the crypto market today: price, volume and dominance
A sound market reading combines data, context and clear risk limits.