
Altcoin season in 2026: 7 indicators to identify the season
A practical guide to identifying an altcoin season: Altcoin Season Index, Bitcoin dominance, ETH/BTC, TOTAL2/TOTAL3, stablecoins, volume and sentiment, with the September 2026 reading.
Quick answer
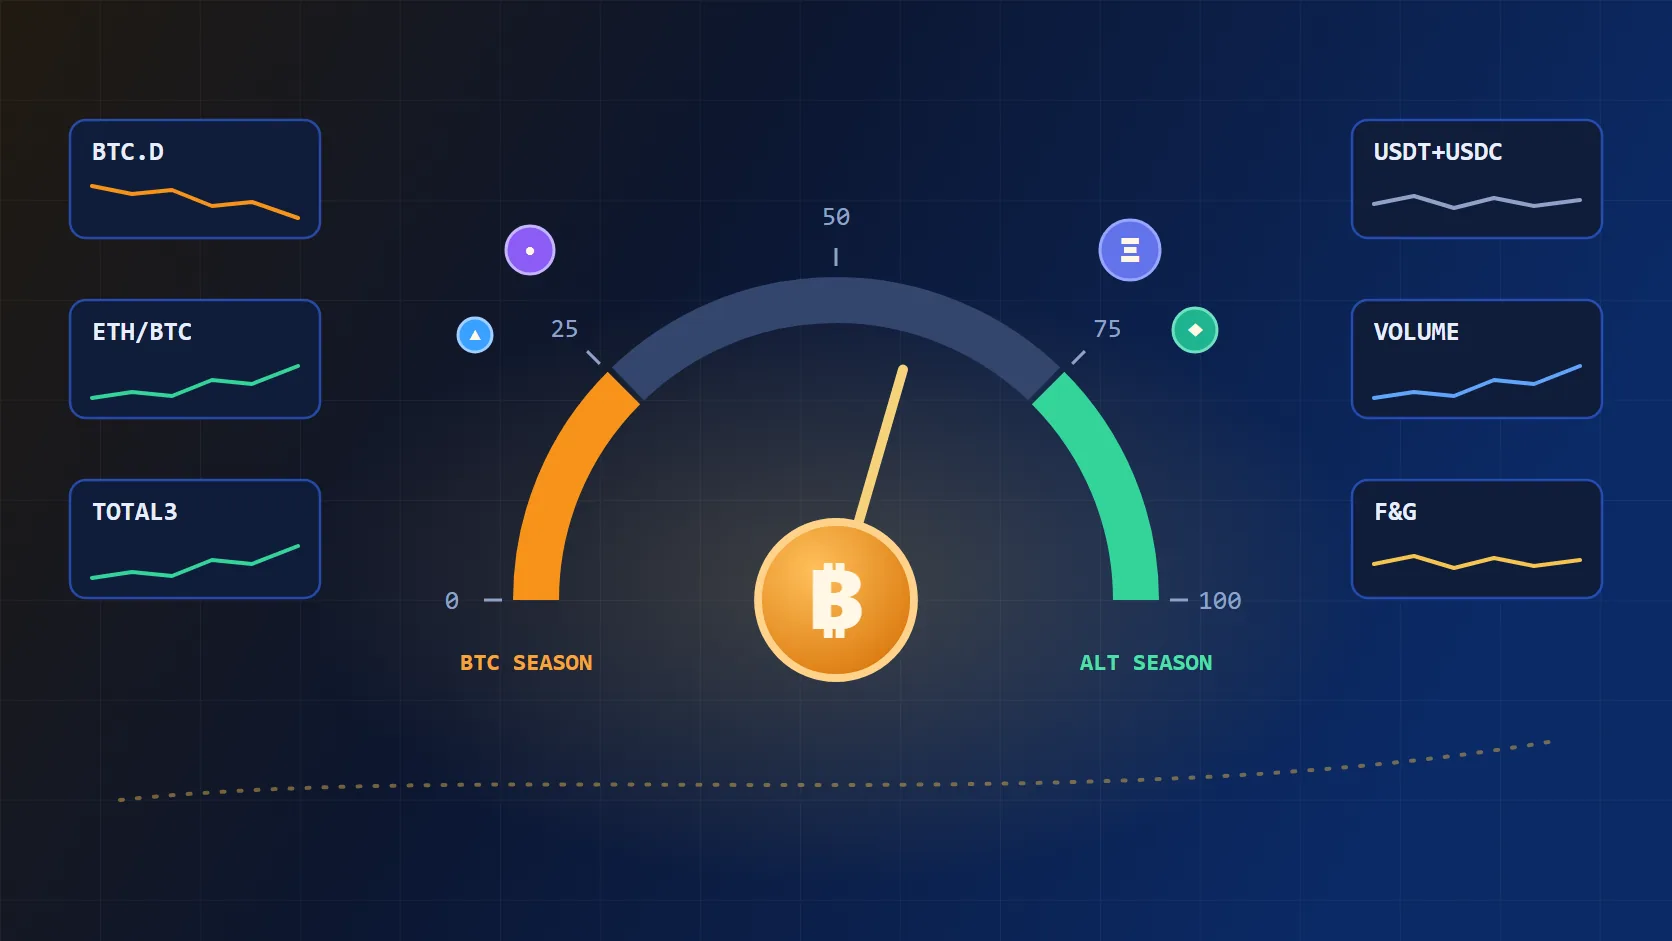
Altcoin season is a period in which most of the leading cryptocurrencies other than Bitcoin (the altcoins) rise more than Bitcoin itself. The most widely used test comes from Blockchaincenter's Altcoin Season Index: it is altcoin season when at least 75% of the 50 largest cryptocurrencies, excluding stablecoins and asset-backed tokens, outperformed Bitcoin over the last 90 days. On September 28, 2026, that index stood at 59, so by the official rule it was not altcoin season, even though the shorter 30-day window was already at 80. No single indicator confirms the season. This guide covers seven indicators, how to read each one, what they showed on the date checked and which traps to avoid, without forecasting prices or recommending purchases.
If you first want to understand market cycles, market phases and the role of the halving, start with Altcoin season: how to identify it and understand the risks. This article is the practical companion: a data-driven checklist.
What counts as altcoin season
There is no single official definition. The two most-cited public indexes use the same logic with different baskets:
- Blockchaincenter: compares the top 50 cryptocurrencies with Bitcoin over 90 days. Stablecoins (such as USDT and DAI) and asset-backed tokens (such as WBTC and stETH) are excluded. Above 75 is altcoin season; 25 or below is "Bitcoin season"; in between is a mixed market.
- CoinMarketCap: uses the same 90-day window and the same 75 and 25 thresholds, but looks at the top 100 coins. Ethereum counts as an altcoin.
In practice, two websites can show different numbers on the same day. Always note which index, which basket and which window you are using.
The 7 indicators and how to read each one
1. Altcoin Season Index: how broad the move is
What it measures: how many large altcoins are beating Bitcoin, not how much they rose. An index of 80 means about 80% of the basket did better than BTC over the chosen window.
How to read it: compare windows. When the 30-day index jumps well ahead of the 90-day index, the rotation into altcoins is recent and has not yet lasted long enough to become a "season". Trap: "beating Bitcoin" also happens in a falling market, if altcoins simply fall less.
2. Bitcoin dominance: BTC's share of the market
What it measures: Bitcoin's market capitalization divided by total market capitalization, times 100. During altcoin season, dominance usually falls as money spreads to other coins.
How to read it: look at dominance together with total market cap. Dominance falling while the total market rises suggests rotation into altcoins. Dominance falling while the total market falls may just mean Bitcoin is falling more. Trap: each provider computes dominance over a different set of assets (CoinGecko tracks more than 21,000), and stablecoin growth lowers BTC dominance without any altcoin rising.
3. ETH/BTC: the gauge of the first rotation
What it measures: how many bitcoins one ether is worth. Because Ethereum is the largest altcoin, money leaving Bitcoin in search of more risk has historically tended to pass through it first.
How to read it: an ETH/BTC uptrend over weeks signals appetite for risk beyond Bitcoin. A rise over a few days does not. Trap: ETH has its own drivers (network upgrades, ETF flows, staking) that can move the pair without the rest of the altcoins following.
4. Market cap without Bitcoin (TOTAL2 and TOTAL3)
What it measures: TOTAL2 is the value of the whole market minus Bitcoin; TOTAL3 also removes Ethereum. The names come from popular technical-analysis charts.
How to read it: if TOTAL3 grows faster than Bitcoin, money is reaching mid- and small-cap altcoins, not just ETH. Trap: these totals include stablecoins. When more digital dollars are issued, TOTAL2 rises without any altcoin gaining value. Compare with the change in stablecoins over the same period.
5. Stablecoins: the market's "cash"
What it measures: the total value of stablecoins such as USDT and USDC and their share of the market. Stablecoins are idle money inside the ecosystem, ready to buy other assets.
How to read it: a growing stablecoin supply means more "dry powder"; a falling stablecoin share while the market rises suggests that cash is being used to buy risk. Trap: stablecoin issuance also reflects use in payments, remittances and markets outside speculative crypto. It is not a guaranteed purchase of altcoins.
6. Altcoin volume and liquidity
What it measures: how much altcoins trade and how easily an order fills without moving the price much.
How to read it: a rally with rising spot volume spread across many coins is more consistent than one concentrated in a few tokens. Trap: a large part of volume is in derivatives (futures contracts), which are not real purchases of the coin, and small coins can have inflated volume or shallow liquidity.
7. Sentiment and leverage
What it measures: market mood (for example, the Fear & Greed index, from 0 to 100) and the level of leveraged bets, seen in the derivatives funding rate and open interest.
How to read it: high euphoria with very positive funding across many altcoins tends to show up at the end of strong moves, not the start. At those times, fast drops can trigger cascading liquidations. Trap: sentiment measures emotion, not direction. It can stay in "greed" for weeks.
The reading on September 28, 2026
| Indicator | Value | Source, period and scope |
|---|---|---|
| Altcoin Season Index (90 days) | 59 — not altcoin season | Blockchaincenter, checked Sep 28, 2026; top 50 coins, excluding stablecoins and asset-backed tokens |
| Same index, 30-day window | 80 | Blockchaincenter, Sep 28, 2026 |
| Same index, 365-day window | 37 | Blockchaincenter, Sep 28, 2026 |
| Bitcoin dominance | ≈ 58.1% | CoinGecko global data, Sep 28, 2026, 14:03 UTC; base of more than 21,000 assets |
| Total market cap | ≈ US$2.87 trillion (−3.3% in 24 h) | CoinGecko, Sep 28, 2026, 14:03 UTC |
| Market without BTC (≈ TOTAL2) | ≈ US$1.20 trillion | Cripto View calculation from CoinGecko data of Sep 28, 2026 (total − BTC); includes stablecoins |
| Market without BTC and ETH (≈ TOTAL3) | ≈ US$0.87 trillion | Cripto View calculation, same base; includes stablecoins |
| ETH/BTC | ≈ 0.0318 | CoinGecko, daily close on Sep 28, 2026; it was ≈ 0.0262 on Jul 1, 2026 |
| ETH/BTC: 12-month low and high | 0.0248 (Jun 7, 2026) and 0.0386 (Oct 7, 2025) | CoinGecko, daily closes from Sep 29, 2025 to Sep 28, 2026 |
| USDT + USDC share of the market | ≈ 9.0% | CoinGecko, Sep 28, 2026; USDT ≈ US$184 billion and USDC ≈ US$75 billion in market cap |
| Fear & Greed | 74 (greed) | Alternative.me, daily reading of Sep 28, 2026 |
As an independent check, Cripto View counted, using CoinGecko data from September 28, how many of the 50 largest altcoins (excluding identifiable stablecoins and asset-backed tokens) beat Bitcoin: about three in four over 30 days, but only half over 200 days. The result is consistent with Blockchaincenter, but it is an approximation: the basket and filter are not identical to the index's.
How to interpret this snapshot: short-term signals point to rotation (30-day index at 80, ETH/BTC about 21% above July, dominance below 60% on CoinGecko's base). Longer-term signals do not confirm it yet (90-day index at 59; over 365 days, most altcoins lost to Bitcoin). Combined with a "greed" reading on the same day the market fell 3.3%, the picture is one of early and still fragile rotation, not an established season. This describes the data on that date; it is not a forecast.
How to combine the signals: a three-question checklist
- Is the move broad? Check the Altcoin Season Index over 30 and 90 days and TOTAL3. A few coins rising a lot is not a season; it is concentration.
- Is the money new or has it just moved? Compare total market cap, stablecoin supply and dominance. Rotation in a shrinking market is more fragile than rotation in a growing one.
- Is the rally sustained or leveraged? Check spot volume, funding and sentiment. Heavy leverage and euphoria raise the risk of a fast reversal.
When all three answers point the same way for several weeks, the reading is more consistent. When they diverge, treat it as a "mixed market", which is the most common state.
What recent history shows
Blockchaincenter's index reached 87 in early December 2024, its highest reading that year. When checked on September 28, 2026, the page itself stated that the last altcoin season under the 90-day rule had ended 367 days earlier, and that the longest season the index has recorded lasted 126 days. In other words, seasons do happen, but they tend to be short and separated by long periods of Bitcoin leadership.
What the data show and what they do not allow us to conclude
They show: whether, over a defined window, most large altcoins did better or worse than Bitcoin; the share of BTC and stablecoins in the market tracked by one provider; and the mood and leverage level on a specific day.
They do not allow us to conclude: that an altcoin season will start or continue; that a specific coin will rise because "the season has arrived"; or that the behavior of past cycles will repeat. The indexes look backward (90 days of past performance), each provider uses a different basket, and the figures in the table are a snapshot of September 28, 2026 that changes by the minute.
Risks and precautions
- Deeper drops than Bitcoin: in risk-off phases, altcoins usually fall more and faster. Seasons end abruptly.
- Shallow liquidity: small coins may have little real volume, and selling in a panic can fill well below the price on screen.
- Dilution: many tokens have scheduled unlocks that increase supply and weigh on price.
- Leverage: trying to "catch the season" with derivatives can wipe out a position on an adverse move.
- Scams and hype: euphoric periods attract copycat tokens, return promises, paid "signals" and fake giveaways. Distrust any guarantee.
- Custody and rules: not every altcoin is available on regulated exchanges in Brazil; confirm availability on the platform's official website and consider custody and counterparty risks.
Checklist before acting
- Write down the index used (Blockchaincenter or CoinMarketCap), the window (30 or 90 days) and the date.
- Check whether BTC dominance is falling with the total market rising or falling.
- Look at the ETH/BTC trend over weeks, not days.
- Compare TOTAL2/TOTAL3 with the change in stablecoins over the same period.
- Check spot volume and liquidity for the coin you are studying.
- Look at funding and sentiment: high euphoria calls for more caution, not less.
- Decide in advance how much you are willing to lose and do not use money you need.
Frequently asked questions
What is the best indicator for altcoin season?
The most direct one is the Altcoin Season Index (above 75 under the Blockchaincenter or CoinMarketCap rule). But it measures the past and only breadth. Use it together with dominance, ETH/BTC, stablecoins and sentiment.
Is it altcoin season right now?
When checked on September 28, 2026, no: Blockchaincenter's 90-day index was at 59. The 30-day window, at 80, showed a recent rotation into altcoins that had not yet lasted long enough to meet the criterion.
Does falling Bitcoin dominance mean altcoin season?
Not necessarily. Dominance can fall because Bitcoin dropped more than altcoins, or because stablecoins gained share. It only suggests rotation when it falls while the total market grows.
Does every altcoin rise during altcoin season?
No. The index requires 75% of the basket to beat Bitcoin; the rest may fall. And outside the top 50 or 100 coins, behavior is even more uneven.
Is altcoin season the time to buy altcoins?
This text makes no recommendation. The indicators describe what already happened and do not guarantee the move will continue. Any decision should consider your goals, time horizon and loss limit.
Read also
- Altcoin season: how to identify it and understand the risks
- Bitcoin beyond price: a guide to reading volume, liquidity and dominance
- Ethereum and altcoins: what they are, risks and advantages for beginners
- Market capitalization: what it measures and what it leaves out
- Risk, liquidity and discipline: how a good idea can become poor execution
Informational and educational content. It is not investment advice, an offer or a solicitation to buy or sell assets.
Sources: Blockchaincenter — Altcoin Season Index (values and methodology); CoinMarketCap — Altcoin Season Index methodology; CoinGecko — global market cap and dominance; CoinGecko — ETH/BTC history; Alternative.me — Crypto Fear & Greed Index; CoinGlass — derivatives funding rates; CryptoRank — index at its 2024 high (Dec 2024). Checked on Sep 28, 2026.
Read more
A sound market reading combines data, context and clear risk limits.