
Volume and OBV: how to read the participation behind price in crypto
How to read volume on the chart and how OBV works, with a worked example, trend confirmation, divergences, breakouts and the limits of using the volume of a single exchange.
Quick answer
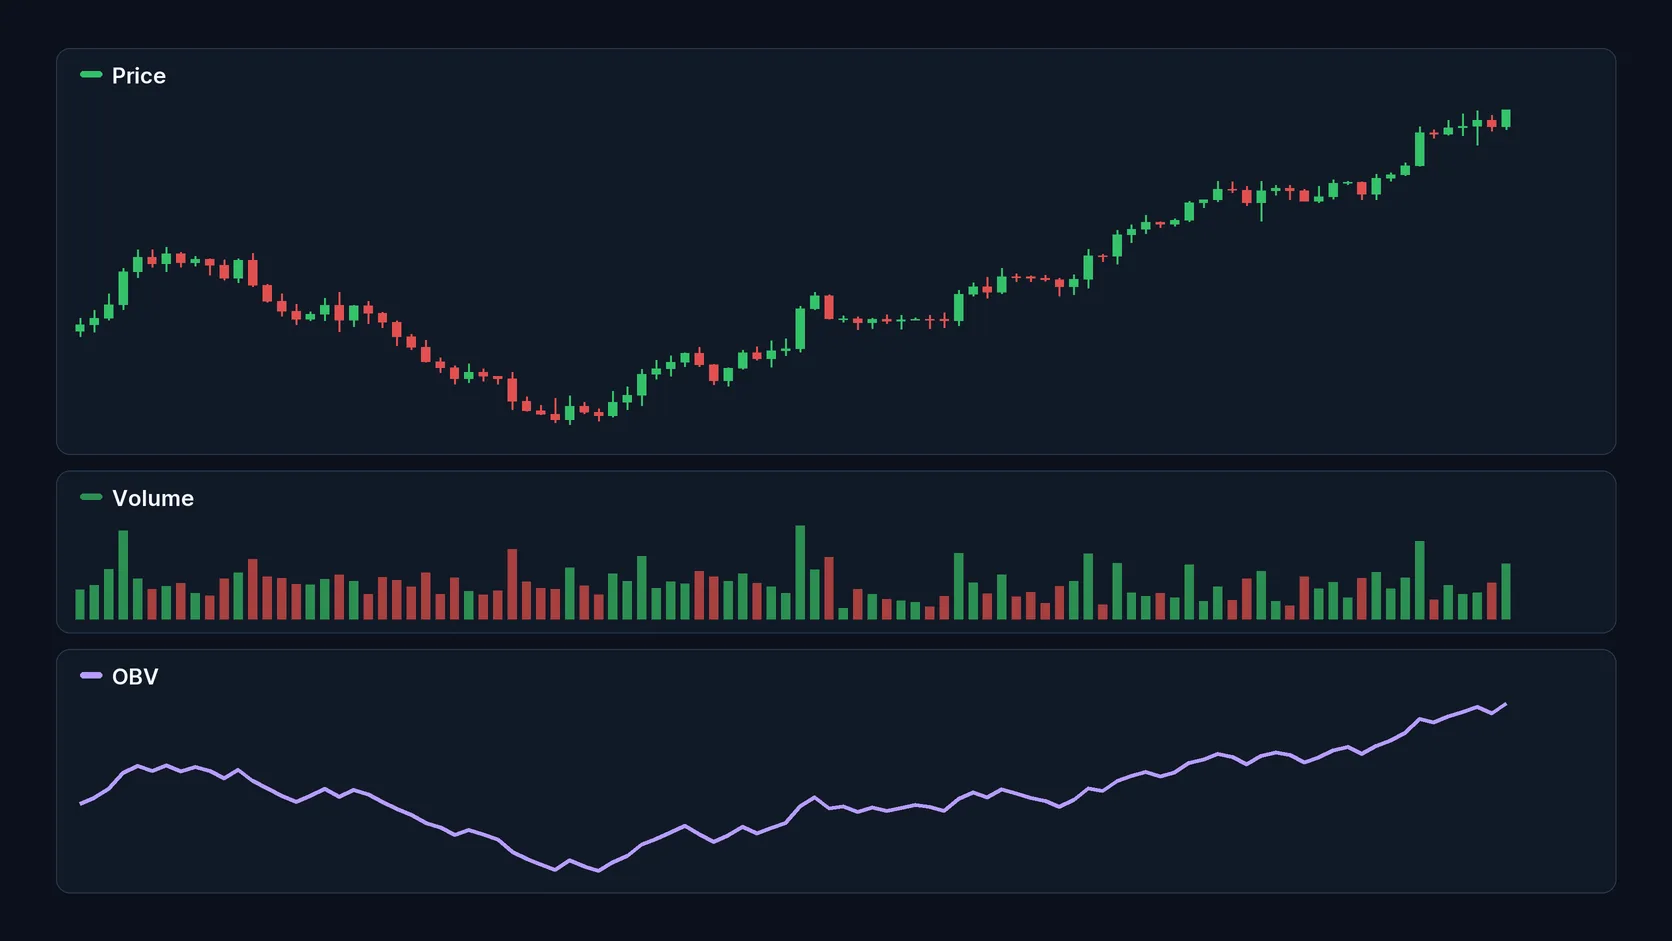
Volume is the amount traded in each period and shows how much participation is behind a price move. OBV (On-Balance Volume) turns that information into a running line: it adds the volume of periods that close higher and subtracts the volume of periods that close lower. The main reading is to compare the direction of OBV with the direction of price. When both rise together, the move is confirmed; when they diverge, it is a warning.
This guide is part of the series on the seven most cited technical indicators. It explains the calculation, the signals and the limits of volume and OBV on the chart. For liquidity, dominance and market-wide volume, see Bitcoin beyond price: a guide to reading volume, liquidity and dominance. There is no buy or sell recommendation.
Where it comes from
OBV was introduced by Joe Granville in 1963, in the book Granville's New Key to Stock Market Profits. Granville's thesis is that volume precedes price: changes in participation would show up before the change in direction. It is a working hypothesis, not a law.
How to read volume
Kraken treats volume as one of the four core variables of technical analysis, alongside trend, momentum and volatility. Three readings are the most common:
- Breakout with volume: a price that breaks resistance on rising volume has more support than a breakout on weak volume.
- Trend with volume: rallies accompanied by rising volume point to participation; rallies on shrinking volume point to fading interest.
- Volume spikes: volume far above normal often marks moments of decision, but it does not say who won. You need to look at the close.
How OBV is calculated
- If the close is higher than the previous one, the period's volume is added to OBV.
- If the close is lower than the previous one, the volume is subtracted.
- If the close is unchanged, OBV does not change.
| Period | Close | Volume | OBV |
|---|---|---|---|
| 1 | Higher | 100 | 100 |
| 2 | Lower | 60 | 40 |
| 3 | Higher | 80 | 120 |
| 4 | Unchanged | 50 | 120 |
Illustrative example, starting from an OBV of zero. Calculation rule: StockCharts ChartSchool, checked on Oct 11, 2026.
The number itself means nothing. It depends on where the count started. What matters is the direction and shape of the line.
How to read OBV
Trend confirmation
First, define the trend of OBV; then see whether it matches the trend of price. OBV and price rising together indicate that the rally has participation.
Divergences
In a bearish divergence, price rises and OBV makes lower highs: the rally is happening with less volume behind it. In a bullish divergence, price makes lower lows and OBV holds or makes higher lows.
OBV breakouts
The OBV line also forms support and resistance. A breakout in OBV can show up before the breakout in price. Kraken gives an example of this use: an OBV trendline broken before price, with a moving average crossover serving as later confirmation.
What changes in crypto
- Fragmented volume: the same coin trades on dozens of exchanges. The volume and OBV on a chart reflect only that platform and that pair, not the whole market.
- Differences between platforms: two exchanges can show OBV lines with different shapes for the same coin over the same period.
- A 24-hour market: there is no opening or closing bell. Volume varies with the time of day and the day of the week, and comparing candles from very different hours can mislead.
- Small coins: with little liquidity, a single large trade creates a spike that distorts OBV for a long time.
Where volume and OBV fail
StockCharts lists the limits: the absolute value of OBV has no meaning, the calculation uses only the close, and volume spikes can distort the line and require a settling period. OBV treats all of a period's volume as "buying" or "selling" depending on the close, which is a simplification. And, like any divergence, OBV divergences can repeat without price changing direction.
OBV should not be used alone. It pairs well with trend indicators, such as moving averages, and volatility indicators, such as Bollinger Bands.
Risks and precautions
- Taking the part for the whole: one exchange's volume is not the market's volume.
- Trusting volume in illiquid coins: low numbers are easy to distort.
- Reading a spike as direction: high volume shows a contest, not a winner.
- Leverage: acting on an OBV divergence with a leveraged position multiplies the loss if it fails.
- Different data across sources: aggregators and exchanges calculate volume with their own criteria.
Checklist for beginners
- I know which exchange and which pair the volume on my chart comes from.
- I check volume before trusting a breakout.
- I look at the direction of OBV, not the number.
- I compare the trend of OBV with the trend of price.
- I am wary of signals in illiquid coins.
Frequently asked questions
What does OBV show?
It shows, on a cumulative basis, whether volume has been concentrated in rising or falling periods. It is used to confirm trends and flag divergences.
Is high volume a bullish signal?
No. High volume shows a lot of trading. The direction depends on how price closes and on the context.
Why is OBV different on each exchange?
Because each chart uses the volume of its own platform and the pair traded there. In crypto, volume is spread across many exchanges.
Does OBV lead price?
That is Granville's thesis, and OBV sometimes turns first. It is not a reliable rule: divergences also fail.
Informational and educational content. It is not an investment recommendation, an offer or a solicitation to buy or sell assets.
Sources: StockCharts ChartSchool — OBV; Kraken Learn — crypto technical indicators (Dec 30, 2025). Checked on Oct 11, 2026.
Read more
- Technical indicators in crypto: the 7 most cited by experts and how to read each one
- Bitcoin beyond price: a guide to reading volume, liquidity and dominance
- Bollinger Bands: how they work and how to read volatility in crypto
- On-chain metrics: four questions before interpreting a chart
- Market capitalization: what it measures and what it leaves out
- How to read the crypto market today: price, volume and dominance
A sound market reading combines data, context and clear risk limits.