
Bitcoin price history: cycles and maximum drawdowns
A quantitative overview of Bitcoin's price from 2009 to September 2026: milestones by phase, each cycle's highs, maximum drawdowns, halvings, sources and what the data does not show.
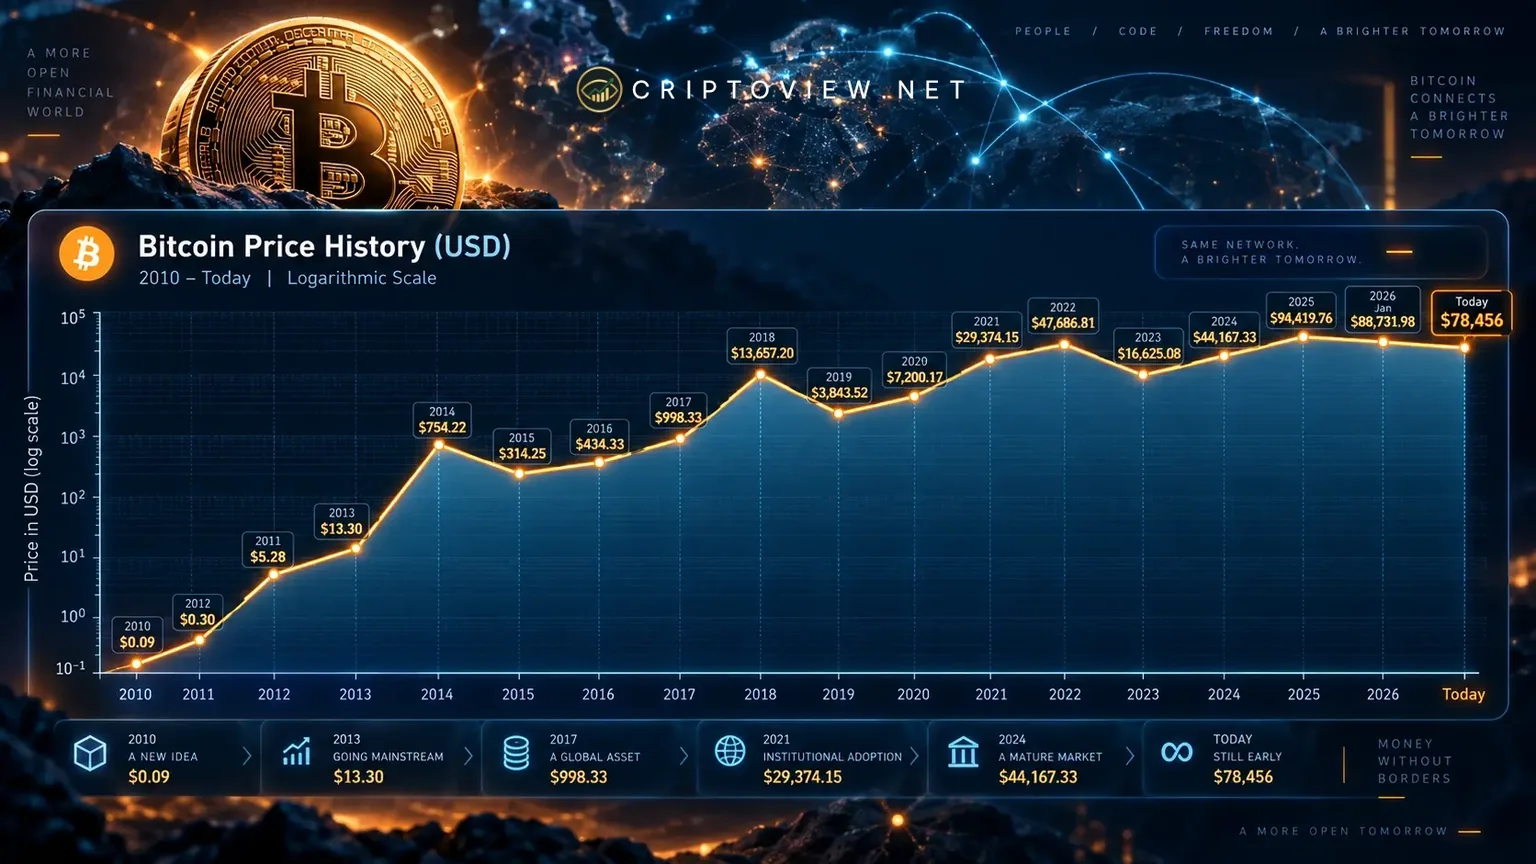
Direct answer
In just over 15 years, Bitcoin's price went from fractions of a US cent in 2010 to an all-time high near US$126k on 6 October 2025. Along the way there were at least four major up-cycles, each followed by a drawdown of 75% to 93% from the peak. On this article's cut-off date, 8 September 2026, Bitcoin traded near US$79k, about 37% below the 2025 high. Every figure here is an approximate US dollar spot price (BTC/USD), meant to convey orders of magnitude and the behaviour of the series, not to reconstruct exact quotes.
How to read these numbers
Before the table and the timeline, fix the method and the limits of the data:
- Reference: Bitcoin's price in US dollars (BTC/USD) on the aggregated spot market. We do not convert to other currencies or adjust for risk or inflation.
- Period: from the genesis block on 3 January 2009 to 8 September 2026 (cut-off date).
- Approximations: figures are rounded. Intraday highs and closing prices differ, and each data provider has a slightly different series — at recent peaks, sources disagree by several thousand dollars.
- “All-time high” (ATH): the highest price ever recorded. The exact value depends on the exchange and source used as reference.
- Old data: before 2013 the record is sparse and comes from a few low-volume exchanges, such as New Liberty Standard and Mt. Gox.
- “Maximum drawdown”: the move from a cycle peak to the lowest quote of the subsequent bear phase.
Price milestones and maximum drawdowns
| Phase | Milestone | Approx. value (USD) | When | Drawdown to next low |
|---|---|---|---|---|
| Origin | Genesis block; no market price | — | 3 Jan 2009 | — |
| 2009–2010 | First published quote (New Liberty Standard) | under US$0.001 | Oct 2009 | — |
| 2010 | “Bitcoin Pizza”: 10,000 BTC for 2 pizzas | ~US$41 total | 22 May 2010 | — |
| 2011 | Parity with the US dollar | US$1 | Feb 2011 | — |
| Cycle 1 | First bubble peak | ~US$31 | Jun 2011 | ~93% (to ~US$2, Nov 2011) |
| Halving 1 | Block reward: 50 → 25 BTC | — | 28 Nov 2012 | — |
| Cycle 2 | Mt. Gox-era high | ~US$1,150 | 30 Nov 2013 | ~85% (to ~US$180, Jan 2015) |
| Cycle 3 | Retail-cycle high | ~US$19,780 | 17 Dec 2017 | ~84% (to ~US$3,200, Dec 2018) |
| Halving 2 | Block reward: 25 → 12.5 BTC | — | 9 Jul 2016 | — |
| 2020 | COVID crash (“Black Thursday”) | ~US$3,850 | 12 Mar 2020 | — |
| Halving 3 | Block reward: 12.5 → 6.25 BTC | — | 11 May 2020 | — |
| Cycle 4 | First 2021 peak | ~US$64,900 | 14 Apr 2021 | ~53% (to ~US$29–30k, Jul 2021) |
| Cycle 4 | 2021 high | ~US$69,000 | 10 Nov 2021 | ~77% (to ~US$15,700, 21 Nov 2022) |
| 2024 | SEC clears US spot Bitcoin ETFs | BTC ~US$46k | 11 Jan 2024 | — |
| Halving 4 | Block reward: 6.25 → 3.125 BTC | — | 19–20 Apr 2024 | — |
| 2024 | First close above US$100k | US$100,000 | 4 Dec 2024 | — |
| Cycle 5 | 2025 highs | US$111,970 (22 May) and ~US$123,400 (14 Jul) | 2025 | — |
| Cycle 5 | Current all-time high | ~US$126,200 | 6 Oct 2025 | ~37% to the cut-off date |
| Current | Price on the cut-off date | ~US$79k | 7–8 Sep 2026 | — |
Halving dates mark when the reward paid to miners per block was cut in half. They appear in the table because much cycle analysis uses the halving as a reference — which does not prove a causal link.
Price timeline, phase by phase
2009–2011: from cents to dollar parity
Bitcoin launched with no market price. The first widely cited quote came from New Liberty Standard in late 2009 and was below one-thousandth of a dollar. On 22 May 2010, a programmer paid 10,000 BTC for two pizzas worth about US$41 — “Bitcoin Pizza Day”. The asset reached US$1 parity in February 2011.
2011: the first bubble
Still in 2011, the price rose to near US$31 in June and then fell about 93%, back to the US$2 range by year-end. It was the first instance of a pattern that would repeat: a fast rise, a wave of attention and a deep pullback.
2013–2015: the Mt. Gox cycle
In 2013, Bitcoin went from about US$13 early in the year to over US$1,000 in November, with a high near US$1,150 — some providers record values above US$1,200 on Mt. Gox, then the market's largest exchange. In February 2014, Mt. Gox halted withdrawals and filed for bankruptcy. The price entered a long decline and reached about US$180 in early 2015, a drawdown of roughly 85%.
2017–2018: the retail cycle
The next cycle took Bitcoin from about US$1,000 in January 2017 to a high around US$19,780 on 17 December of the same year. It was the first large cycle with broad retail participation and heavy press coverage. In 2018, the price fell to near US$3,200, a drop of about 84%.
2020–2022: COVID, institutions and the FTX collapse
On 12 March 2020, “Black Thursday” drove Bitcoin to near US$3,850 amid the pandemic shock. The recovery was fast: the asset ended 2020 above US$29k. In 2021 there were two peaks — about US$64,900 on 14 April and about US$69,000 on 10 November. In 2022, the collapse of the Terra ecosystem and the bankruptcy of the FTX exchange pushed the price to near US$15,700 on 21 November, a drawdown of roughly 77% from the peak.
2023–2025: ETF, halving and the US$100k mark
Bitcoin recovered through 2023. On 11 January 2024, the US SEC cleared the first US spot Bitcoin ETFs for trading, with the price near US$46k. The fourth halving took place on 19–20 April 2024, cutting the block reward from 6.25 to 3.125 BTC. On 4 December 2024, Bitcoin passed US$100k for the first time. In 2025 it recorded US$111,970 on 22 May, about US$123,400 on 14 July and the all-time high near US$126k on 6 October.
2026 so far
After the October 2025 peak, the price entered a downturn. According to September 2026 market data, Bitcoin fell to a low in early August 2026 and then recovered about 23%, trading near US$79k on 7–8 September — roughly 37% below the 2025 high.
Halvings and cycles: what the series suggests
Every 210,000 blocks, roughly every four years, the reward paid to miners per block is halved. There have been four halvings: November 2012, July 2016, May 2020 and April 2024. In the 12 to 18 months after each of the first three, Bitcoin posted large gains and new all-time highs.
This feeds the idea of a “four-year cycle”. Caution is warranted: these are few events, which makes any pattern statistically fragile, and each cycle coincided with major external factors — interest rates, global liquidity, new financial products, regulation and exchange failures. The series shows correlation between halving and rallies, not a guaranteed cause-and-effect relationship.
What the data shows — and what it does not
What the series shows: Bitcoin's price grew several orders of magnitude since 2010, in cycles of strong gains followed by deep declines. In every major cycle, the pullback from peak to the next low ran between roughly 75% and 93%. Regaining a prior peak took one to three years, when it happened.
What the series does not show:
- It does not predict future prices. The record describes the past; there is no guarantee the patterns repeat.
- Cycle patterns rest on three or four repetitions — too small a sample for firm conclusions.
- Everything is in US dollars. For investors using another currency, exchange-rate moves change the return, and that conversion is not included here.
- There is no adjustment for risk, inflation or opportunity cost. “Going back up” does not mean it was a good investment at any entry point.
- Survivorship bias: we analyse Bitcoin because it survived. Most crypto assets launched in the same period lost nearly all their value.
- The numbers are approximate and vary by exchange, time zone and methodology, especially in the early years and at the most recent peaks.
Frequently asked questions
What is the highest price Bitcoin has ever recorded?
A high near US$126k, on 6 October 2025. Sources range from about US$124.7k to US$126.2k for that date. Before that, the record was about US$69k, in November 2021.
How far has Bitcoin fallen after a peak?
In every major cycle, the drop from peak to the next low ran between roughly 75% and 93%. Prolonged declines after a high are part of the asset's history.
Does the halving make the price go up?
There were large gains in the 12 to 18 months after each of the first three halvings, but these are few events and other factors were acting at the same time. The series shows correlation, not a guarantee.
Where can I check the full historical series?
Providers such as CoinGecko publish the daily BTC/USD history. Compare more than one source, because the series diverge, especially in the early years.
The 2026 price is below the peak. Is that normal?
Prolonged declines after a high occurred in every previous cycle. From the series alone, there is no way to know whether or when a new peak would come.
Sources
- CoinGecko — Bitcoin (BTC): BTC/USD price and history. Accessed 8 Sep 2026.
- CoinGecko — Bitcoin Halving: dates and block rewards.
- Kraken — The history of Bitcoin halving.
- CoinDesk — coverage of the 2013 rally.
- TechCrunch — reference to the November 2021 high (~US$69k).
- NPR — Bitcoin passes US$100k for the first time (Dec 2024).
- ETF.com — first year of US spot Bitcoin ETFs (approved Jan 2024).
- Forbes — new all-time high on 6 October 2025.
- Fortune — Bitcoin price in September 2026. Accessed 8 Sep 2026.
Before buying, check current conditions, the referral programme rules and the market and custody risks.
Where to buy BitcoinReferral link: signing up here supports Cripto View at no extra cost to you — the reward comes from the platform's own programme.
Informational and educational content. It is not investment advice, an offer or a solicitation to buy or sell assets.
Read more
- Bitcoin for beginners: what to learn before buying
- What is Bitcoin: origin, evolution and how it is used today
- Altcoin season: how to identify it and understand the risks
- Market capitalization: what it measures and what it leaves out
- How to read the crypto market today: price, volume and dominance
- Bitcoin beyond price: a guide to reading volume, liquidity and dominance
A sound market reading combines data, context and clear risk limits.