
Stochastic Oscillator: %K, %D, StochRSI and how to read it in crypto
What the Stochastic Oscillator is, how to calculate %K and %D, the difference between the fast, slow and full versions, what StochRSI is and why the indicator fails in trends.
Quick answer
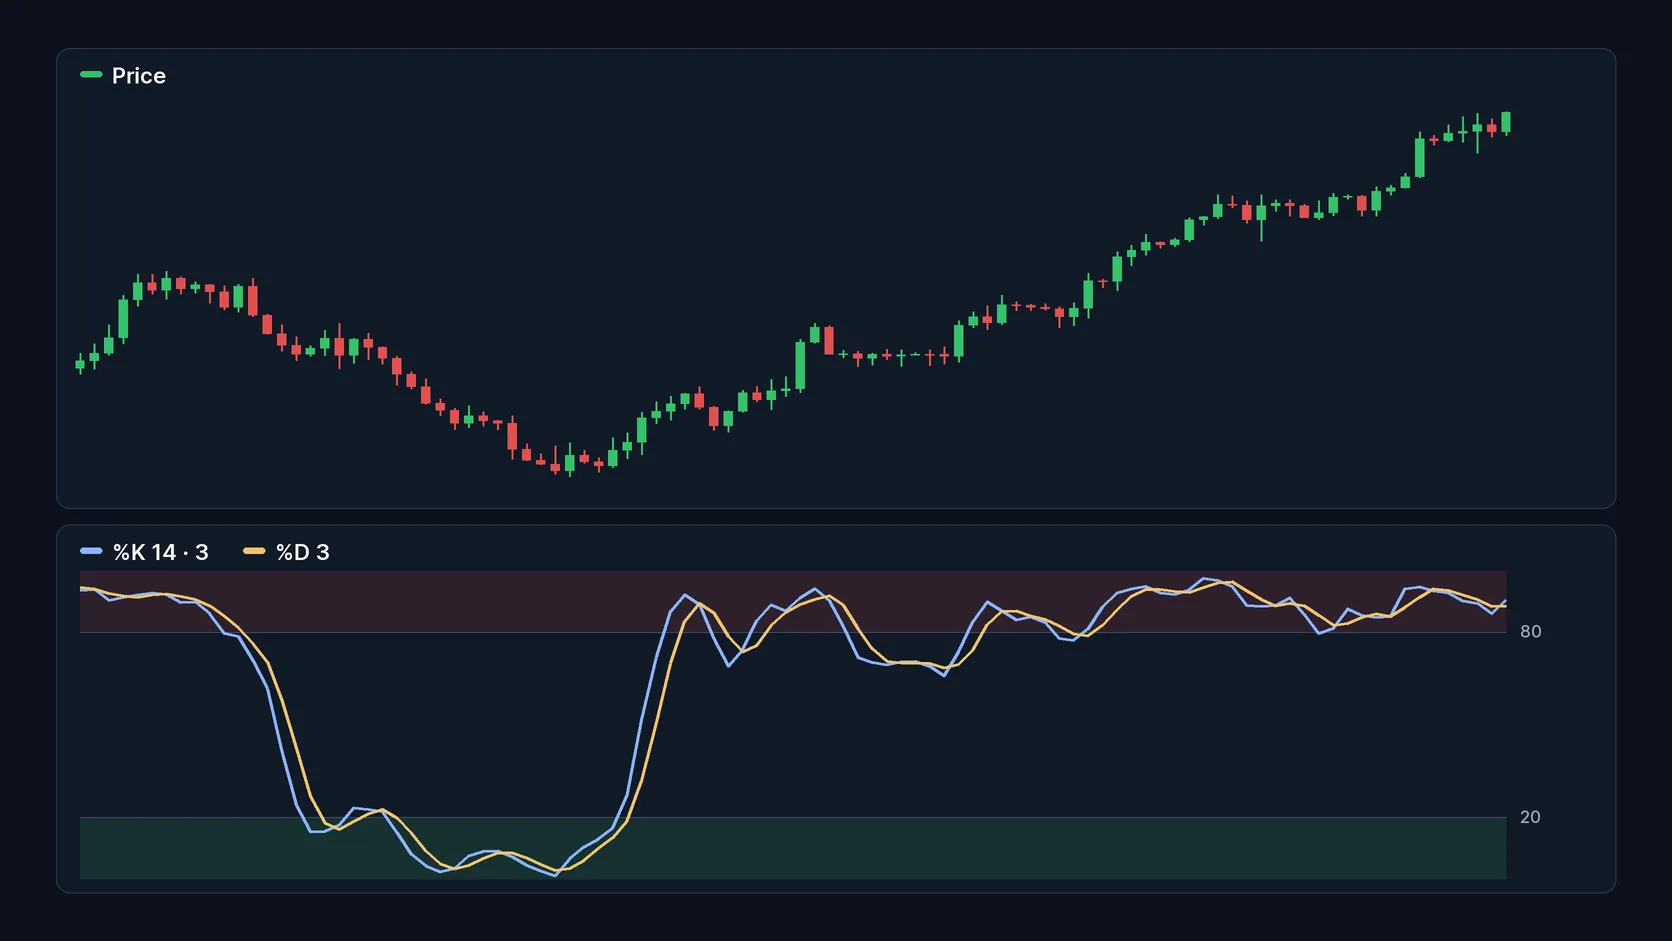
The Stochastic Oscillator shows where the closing price sits within the range between the high and the low of the last periods, on a scale from 0 to 100. Near 100, the close is right at the recent high; near 0, at the low. Above 80, the reading is overbought; below 20, oversold. It has two lines, %K and %D, and the default is 14 periods.
This guide is part of the series on the seven most cited technical indicators. It explains the calculation, the versions, StochRSI and the limits. There is no buy or sell recommendation.
Where it comes from
The indicator was created by George Lane in the late 1950s. According to Lane, it does not follow price or volume: it follows the speed, or momentum, of price. The premise is that momentum tends to change direction before price does.
How the Stochastic is calculated
- %K: (current close − lowest low of the period) ÷ (highest high of the period − lowest low of the period) × 100.
- %D: the 3-period simple moving average of %K.
An illustrative example: over the last 14 periods, the high was 120 and the low was 100. If the current close is 115, %K is (115 − 100) ÷ (120 − 100) × 100 = 75. The close is three quarters of the way from the low to the high.
Fast, slow and full
| Version | %K | %D | Feature |
|---|---|---|---|
| Fast | Basic calculation | 3-period average of %K | Very sensitive and choppy |
| Slow | Fast %K smoothed over 3 periods | 3-period average of slow %K | Smoother; the most used |
| Full | Configurable smoothing | Configurable period | Adjustable version of the slow one; default 14, 3, 3 |
Source: StockCharts ChartSchool, checked on Oct 11, 2026.
How to read it
Overbought and oversold
The levels are 80 and 20. Above 80, the close is near the top of the recent range; below 20, near the bottom. As with RSI, this describes where price is, not what it will do next. In strong trends, the Stochastic gets stuck in the extreme zones.
%K and %D crossover
When %K crosses below %D inside the overbought zone, the reading is a possible loss of strength. Crossing above, inside the oversold zone, a possible recovery. These signals are frequent and prone to many false alarms.
Divergences and the 50 line
Divergences between the Stochastic and price are read as fading momentum. Crosses of the 50 line show whether the close is in the upper or lower half of the recent range.
StochRSI: the Stochastic applied to RSI
StochRSI was developed by Tushar Chande and Stanley Kroll, authors of the 1994 book The New Technical Trader. Instead of price, it applies the Stochastic formula to the values of RSI: (RSI − lowest RSI of the period) ÷ (highest RSI − lowest RSI). The result runs from 0 to 1, with overbought above 0.8 and oversold below 0.2.
The reason it was created is that RSI can go a long time without reaching 70 or 30. StochRSI is more sensitive and gives more signals. The cost is well known: it is an indicator of an indicator, two steps removed from price, highly volatile, and it produces more false signals than RSI. Binance Academy includes StochRSI among its five essential indicators with that same caveat.
Settings
The default is 14 periods, with smoothing of 3. A shorter period makes the indicator choppier; a longer one makes it slower, with fewer signals. The 80 and 20 levels can also be adjusted.
What changes in crypto
- Extreme zones for a long time: in strong rallies and declines, the Stochastic can stay above 80 or below 20 for weeks.
- A lot of noise on short timeframes: volatility makes the lines cross repeatedly on minute charts.
- Long wicks: the formula uses the high and the low. An extreme wick, common in illiquid coins, changes the range and distorts the reading for the next 14 periods.
Where the Stochastic fails
It does best in sideways markets, where price swings inside a range. In trends, it only helps when the move advances in a zigzag. StockCharts warns that the early signals, such as crossovers and moves through 80 and 20, are frequent and prone to error.
Another point: the Stochastic measures momentum, the same dimension as RSI. Using both together does not produce two confirmations. To confirm, combine it with trend, such as moving averages, or with volume.
Risks and precautions
- Trading against the trend: selling every reading above 80 in a strong rally piles up losses.
- Too many signals: following each crossover produces many trades, fees and errors.
- StochRSI: more sensitivity means more false alarms.
- Leverage: frequent signals with leverage raise the risk of liquidation.
- Liquidity: in small coins, isolated highs and lows distort the calculation.
Checklist for beginners
- I know which version I am using: fast, slow or full.
- I identify whether the market is sideways or trending before reading 80 and 20.
- I do not use Stochastic and RSI as if they were independent confirmations.
- I wait for confirmation from price before giving weight to a crossover.
- I know StochRSI is more sensitive and is wrong more often.
Frequently asked questions
What is the difference between Stochastic and RSI?
Both measure momentum. RSI compares recent gains and losses; the Stochastic compares the close with the range between the high and the low. The Stochastic tends to be faster and choppier.
What are %K and %D?
%K is the main line, showing where the close sits in the recent range. %D is the 3-period average of %K and works as the signal line.
Is Stochastic above 80 a sell signal?
Not by itself. It indicates that the close is near the recent high. In uptrends, that can last a long time.
Is StochRSI better than the Stochastic?
It is more sensitive, not better. It gives more signals and more false signals, and works best with confirmation from other tools.
Informational and educational content. It is not an investment recommendation, an offer or a solicitation to buy or sell assets.
Sources: StockCharts ChartSchool — Stochastic Oscillator; StockCharts ChartSchool — StochRSI; Binance Academy — five essential indicators used in technical analysis (updated Jun 18, 2026); Kraken Learn — crypto technical indicators (Dec 30, 2025). Checked on Oct 11, 2026.
Read more
- Technical indicators in crypto: the 7 most cited by experts and how to read each one
- RSI: how the Relative Strength Index works and how to read it in crypto
- Moving averages in crypto: SMA, EMA, crossovers and limits
- Bollinger Bands: how they work and how to read volatility in crypto
- How to read the crypto market today: price, volume and dominance
- What a market dashboard shows — and what it still cannot answer
A sound market reading combines data, context and clear risk limits.