
Bitcoin and ETFs: why capital inflows do not guarantee a higher price
In 2025, US Bitcoin ETFs took in $21.4 billion and the coin fell about 6%. See how money enters an ETF, five reasons flows and price come apart and how to read this figure, with numbers from 2024 to October 2026.
Quick answer
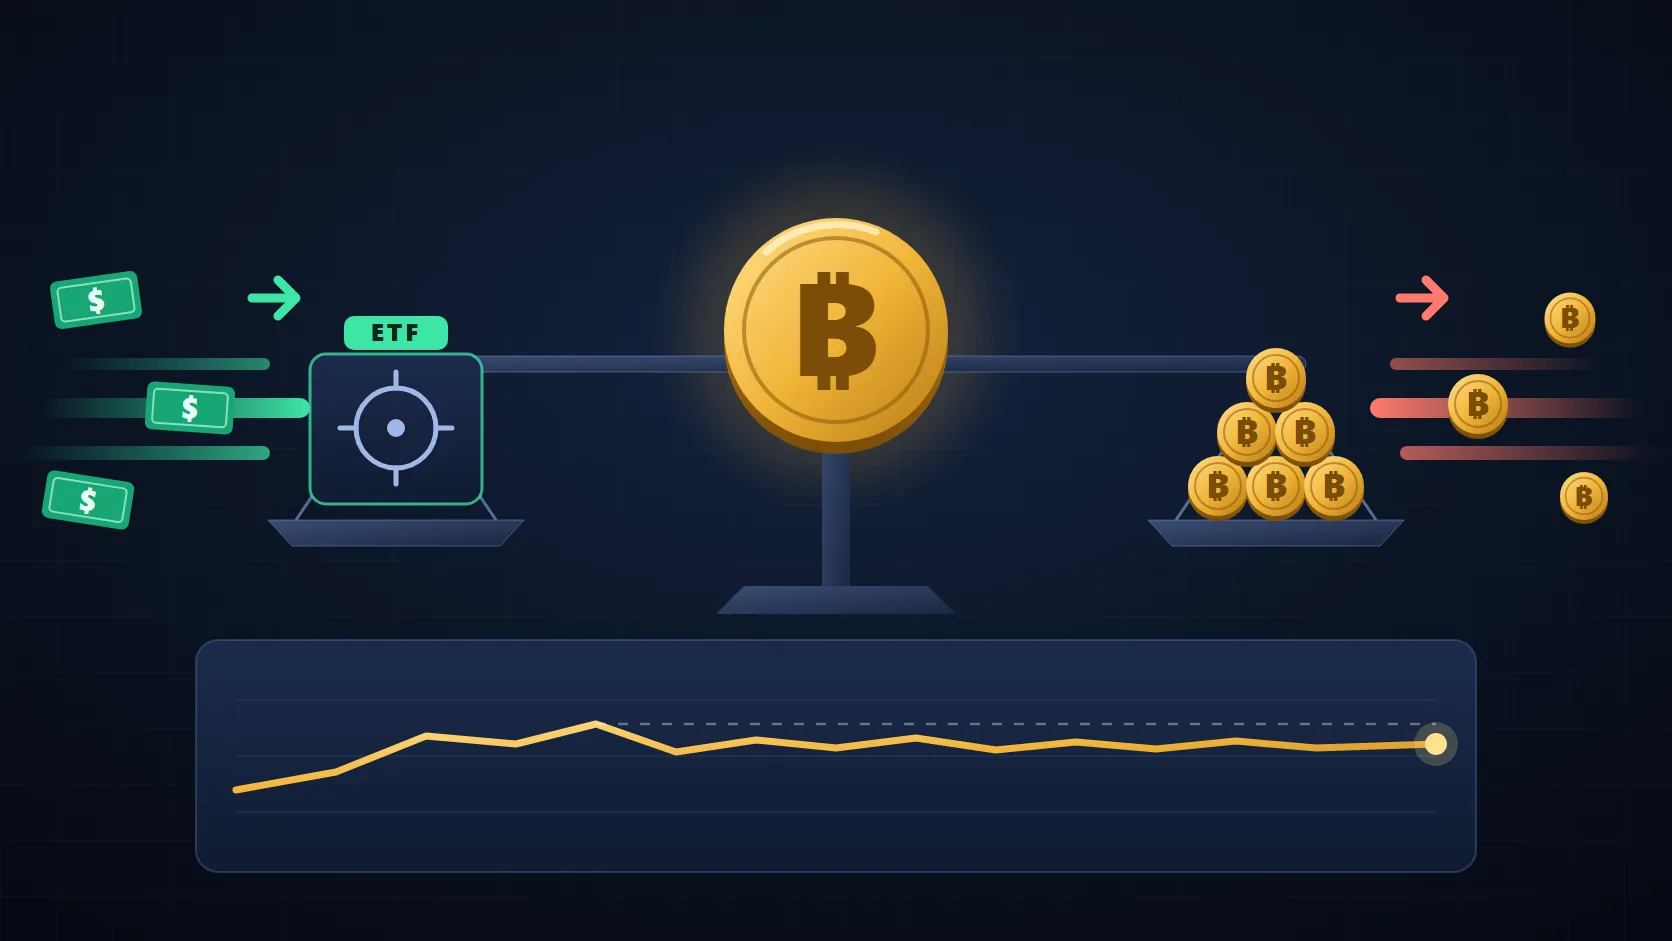
Capital flowing into Bitcoin ETFs does not guarantee a higher price because the published number shows only one side of the trade. For every new share a fund creates, someone sold the bitcoins that now back it. If the sellers (long-standing investors taking profit, funds running arbitrage, miners) deliver as much as the ETFs buy, the price stays flat or falls, even with billions of dollars coming in. The data confirms it: in 2025, US spot Bitcoin ETFs took in a net $21.4 billion and Bitcoin ended the year about 6% below where it started. In September 2026, $2.65 billion came in and, after the 21st, the price barely moved.
This article explains how money enters an ETF, shows the numbers with source, period and scope, and lists five reasons why flows and price come apart. It contains no price forecast and no recommendation to buy or sell. If the product is new to you, start with Crypto ETFs: what changes for beginners and what stays the same.
How money enters a Bitcoin ETF
A spot Bitcoin ETF (exchange-traded fund) holds actual bitcoins and issues shares that track the coin's price. There are two different markets around it, and mixing them up is the source of many misreadings:
- Secondary market: the stock exchange, where investors buy and sell shares among themselves. When you buy a share from someone who already owned it, no bitcoin is bought. Money just changes hands.
- Primary market: where shares are created or destroyed. Institutions called authorized participants deliver cash or bitcoins to the fund and receive new shares (creation), or hand shares back and receive the asset (redemption).
The number in the headlines, the net inflow, is the primary-market balance: the value of shares created minus the value of shares redeemed, in dollars, over a day, a week or a year. It measures how much the fund grew through share creation. It does not measure who sold the bitcoins, at what price, or whether the share buyer placed an offsetting trade in another market.
One technical detail matters here. Until July 2025, US Bitcoin ETFs could only create and redeem shares in cash. On July 29, 2025, the SEC, the US securities regulator, began allowing in-kind creations and redemptions, meaning direct delivery of bitcoins. In practice, an authorized participant can deliver bitcoins it already held or bought away from exchanges, in direct deals between institutions (the over-the-counter, or OTC, market). The inflow shows up in the statistics, but the purchase may never have touched the order book that forms the price on your screen.
What the numbers show
The table gathers the indicators used in this article. All flows refer only to spot Bitcoin ETFs listed in the United States. ETFs traded in Brazil and other countries are not included.
| Indicator | Value | Source, period and scope |
|---|---|---|
| Net inflow in 2024 | $35.2bn | CoinDesk, using SoSoValue data; full year 2024 (the funds launched on Jan 11, 2024) |
| Net inflow in 2025 | $21.4bn | CoinDesk, using SoSoValue data; full year 2025 |
| Bitcoin in 2025 | ≈ −6% on the year | Tiger Newspress, year-to-date change through Dec 29, 2025; Dec 31, 2025 close at $87,575 (CoinGecko) |
| 2026 flows at the low point | ≈ −$5.8bn | CoinDesk and The Block, using SoSoValue data; Jan 1 to Jul 13, 2026 |
| 2026 flows after the turnaround | ≈ +$0.93bn | The Block, using SoSoValue data; Jan 1 to Sep 25, 2026 |
| Net inflow in August 2026 | $3.52bn | The Block, using SoSoValue data, cited by KuCoin News on Oct 2, 2026 |
| Net inflow in September 2026 | $2.65bn | Same source; month of September 2026 |
| Week ended Sep 25, 2026 | $2.4bn | The Block, using SoSoValue data; largest week since the one ended Oct 10, 2025 ($2.7bn) |
| Week ended Oct 2, 2026 | $241m | Crypto Briefing, using SoSoValue and Farside Investors data; IBIT +$450m and FBTC −$168m |
| Cumulative net inflow | ≈ $57.8bn | Crypto Briefing, using SoSoValue data; Jan 2024 to Oct 2, 2026 |
| ETF assets | ≈ $108.9bn (6.42% of Bitcoin's market value) | Crypto Briefing, using SoSoValue data; Oct 2, 2026 |
| Bitcoin price: Jun 30, Sep 21, Sep 30 and Oct 2, 2026 | $58,566, $86,597, $83,576 and $84,506 | CoinGecko, daily closes (00:00 UTC of the following day) |
| Profit realized by long-term holders | Share rose from 34% to 55% of realized profit | Glassnode, report of Sep 30, 2026; week to Sep 29, 2026; coins unmoved for more than 155 days |
| Daily Bitcoin volume (spot exchanges + US ETFs) | ≈ $6.4bn a day | Glassnode, report of Sep 30, 2026; period average, near the bottom of its range since the ETFs launched |
| Annualized three-month futures premium | ≈ 3%, below the ≈ 3.8% on the two-year US Treasury note | CoinDesk, Aug 10, 2026; Bitcoin futures |
| Correlation between flow changes and price changes | 0.30 (less than 10% of price changes explained) | FalconX, study of Oct 11, 2024; daily data from Jan 11 to Oct 2024 |
Data providers are not identical. SoSoValue and Farside Investors compile the same funds but can differ on some days because of cut-off times and revisions. Always note which source and which period you are reading.
Five reasons inflows do not become a rally
1. For every buyer there is a seller
An ETF does not create demand in a vacuum: it buys from someone. Price only rises when buyers agree to pay more than sellers were asking before. If a lot of supply is waiting at a given level, the buying is absorbed without moving the price.
That is what Glassnode, an on-chain data firm, described in late September 2026. In the week to September 29, long-term holders (wallets with coins unmoved for more than 155 days) nearly doubled their realized profit compared with the previous week, and their share of all realized profit went from 34% to 55%. In the same report, the firm pointed to a block of sell orders between $85,000 and $85,500 on Binance's spot order book that had tripled in size since September 24. New money came in through the ETFs; old bitcoin went out the other side.
2. Part of the buying comes with a sale in the futures market
Not every share buyer is betting on a rise. Some funds run an arbitrage called the basis trade (or cash and carry): they buy the ETF and, at the same time, sell Bitcoin futures on the CME, the Chicago derivatives exchange. Because the future usually trades slightly above the spot price, the gap becomes an interest-like return that does not depend on Bitcoin going up or down.
This trade produces an ETF inflow, but the futures sale offsets the purchase. The net effect on price tends to be small. It also explains outflows that are not pessimism: when the premium shrinks, the fund unwinds the position and redeems the shares. In March 2025, CoinDesk reported that unwind with the premium near 2% a year. On August 10, 2026, the annualized three-month premium stood at about 3%, below the roughly 3.8% paid by the two-year US Treasury note, which removes the appeal of the trade. Public flow numbers do not separate directional buying from arbitrage.
3. The ETF is only part of the market
On October 2, 2026, US spot ETFs held the equivalent of 6.42% of Bitcoin's market value. The price is formed worldwide, 24 hours a day, on spot exchanges, in derivatives markets and in over-the-counter deals. According to Glassnode, combined volume on spot exchanges and US ETFs was about $6.4 billion a day in late September 2026. An inflow of $241 million over a whole week is small next to that.
In addition, ETFs only trade during US market hours, on business days. Bitcoin moves at night, on weekends and on holidays, with no ETF flow taking place at all.
4. Flows tend to follow price, not the other way around
Many people buy shares after the price has already risen and redeem after it has fallen. On July 13, 2026, the ETFs had about $5.8 billion in outflows for the year, with Bitcoin near $62,000, not far above its June 30 close of $58,566. Most of the money came back in August and September, when the coin had already climbed. Anyone who read the July outflow as a sign of further decline got the direction wrong.
A FalconX study using daily data from the ETFs' first ten months (January to October 2024) found a correlation of 0.30 between changes in flows and changes in price. That means less than 10% of the price swing was explained by flows. The same study found that flows help anticipate price in statistical tests, but with a small effect (about 1.2% at the peak, three to four days later) and with the caveat that this does not prove causation. The relationship exists, it is weak, and it changes over time.
5. The net number hides what happens inside it
A net inflow is a sum of funds that may be moving in opposite directions. In the week ended October 2, 2026, BlackRock's IBIT took in $450 million while Fidelity's FBTC lost $168 million. In 2025, according to a review published by Tiger Newspress with data through December 29, IBIT gathered $24.8 billion and the other spot Bitcoin ETFs, combined, saw $3.5 billion in outflows. A positive total can be a single fund growing while the others shrink.
There are three more practical limits. Flows are reported in dollars, so the same inflow buys fewer bitcoins when the price is high. They are published with a one-day delay. And they do not say who bought: the quarterly reports of large managers (Form 13F) come out weeks later and do not show short positions in futures.
Three moments when flows and price came apart
- The year 2025: a net inflow of $21.4 billion, the second-largest in these funds' short history. Bitcoin hit a record in October ($126,296, according to The Block) and ended December about 6% below the start of the year. A lot of money came in and the year was negative.
- July 2026: cumulative outflows of $5.8 billion for the year on July 13. The price did not collapse from there: Bitcoin closed the third quarter at $83,576, up almost 43% from $58,566 on June 30. The outflow came near the bottom.
- Late September 2026: on September 21, Bitcoin rose from $81,169 to $86,597, with about $1 billion of inflows that day, according to Glassnode. Here flows and price moved together. Over the two weeks ended September 25 and October 2, inflows totaled about $2.64 billion. Even so, the October 2 close ($84,506) was 2.4% below the September 21 close.
The third case is the most instructive: within the same stretch there was one day when the inflow coincided with a sharp rise and several days when it was absorbed with no visible effect.
How to read a flow figure: four questions
- How big is it in relative terms? Compare the inflow with daily traded volume and with the funds' assets. $300 million sounds large in isolation and is small next to billions traded per day.
- Who is on the other side? Check whether older holders are selling more (on-chain data, such as Glassnode's) and whether a lot of supply is sitting near the current price. The guide On-chain metrics: four questions before interpreting a chart helps with this reading.
- Is the buying directional or hedged? A high premium in the futures market favors arbitrage. In that setting, part of the inflow is not a bet on a rise.
- Did the flow come before or after the price? An inflow after a strong rally is usually a reaction. Compare the dates instead of assuming the money caused the move.
What the data shows and what it does not allow us to conclude
It shows: how much net money entered or left US spot Bitcoin ETFs in each period; that there was a full year (2025) and recent weeks (late September 2026) with meaningful inflows and a falling or flat price; that some of the sellers, in the latter case, were long-term holders taking profit; and that the statistical relationship between flows and price, in the period FalconX studied, was weak.
It does not allow us to conclude: that ETF inflows are irrelevant to price (on September 21, 2026 both rose together); that outflows signal a future decline; what exact portion of inflows is arbitrage, because that data is not public; or what will happen to the price. The numbers come from US funds, are compiled by private providers that may disagree with each other, and the correlation study covers only 2024. The values in the table are a snapshot of the dates shown.
Risks and precautions
- Market risk: Bitcoin can fall sharply even with ETF inflows. In 2026, the price went from $87,575 at the end of 2025 to below $60,000 in June.
- Information risk: "record inflow" headlines circulate without a period, a source or context. One day of flows is not a trend.
- Product risk: an ETF share is not bitcoin in your wallet. There is a management fee, fund custody risk and counterparty risk, and you cannot move the asset on the network.
- Currency and jurisdiction risk: the data in this article is from US ETFs, priced in dollars. ETFs listed on Brazil's B3 exchange have their own rules, costs, taxation and flows, which do not appear in these statistics. Confirm the terms in the fund's prospectus and on the manager's website.
- Leverage risk: trading derivatives to "follow the flow" can lead to liquidation of the position in fast moves.
- Regulatory risk: rules on ETFs, custody and taxation change. What applies today in the US or in Brazil may be altered.
Checklist before reacting to a flow headline
- Note the source (SoSoValue, Farside or another), the period and whether the number is daily, weekly or cumulative.
- Check whether it is the net inflow for all funds or for just one.
- Compare the value with Bitcoin's daily volume and with ETF assets.
- Look at what the price did on the same dates, before and after.
- Look for signs of selling by older holders and of supply concentrated near the price.
- Remember that US ETFs do not trade at night or on weekends.
- Decide beforehand how much you accept losing and do not use money you need.
Frequently asked questions
If ETFs are buying, why isn't Bitcoin rising?
Because someone is selling to the same extent. In late September 2026, Glassnode showed long-term holders stepping up profit-taking while the ETFs were receiving money. When buying and selling balance out, the price stands still.
Is an inflow into Bitcoin ETFs a bullish signal?
It is not a reliable signal on its own. In 2025, $21.4 billion came in and Bitcoin fell about 6% on the year. Flows describe what has already happened in the funds' primary market; they do not predict the price.
Do ETF outflows mean Bitcoin will fall?
No, not necessarily. On July 13, 2026, the ETFs had $5.8 billion in outflows for the year and the price rose almost 43% over the quarter. Outflows tend to happen after declines and may reflect arbitrage being unwound, not pessimism.
What is the basis trade?
It is an arbitrage in which a fund buys the ETF and sells Bitcoin futures at the same time, to earn the price gap between the two. It produces an ETF inflow with no bet on a rise, because the futures sale offsets the purchase.
Where can I track Bitcoin ETF flows?
Farside Investors and SoSoValue publish daily tables by fund, and CoinShares publishes a weekly report on crypto investment products. The numbers can vary slightly between sources.
Does this data apply to ETFs traded in Brazil?
No. All the flows cited here are from spot ETFs listed in the United States. ETFs on B3 have their own data, published by the managers and the exchange.
Read also
- Crypto ETFs: what changes for beginners and what stays the same
- Bitcoin beyond price: a guide to reading volume, liquidity and dominance
- Bitcoin price history: cycles and maximum drawdowns
- On-chain metrics: four questions before interpreting a chart
- Main ways to invest in the crypto market
Informational and educational content. It does not constitute investment advice, an offer or a solicitation to buy or sell assets.
Sources: CoinDesk — annual Bitcoin ETF flows and the Jul 13, 2026 deficit (Sep 25, 2026); The Block — $2.4bn week and 2026 balance (Sep 26, 2026); Crypto Briefing — week ended Oct 2, 2026, cumulative total and assets; KuCoin News — August and September 2026 inflows (Oct 2, 2026); Glassnode — "Strength Meets a Wall" (Sep 30, 2026); CoinDesk — basis trade and futures premium (Aug 10, 2026); CoinDesk — cash-and-carry unwind (Mar 21, 2025); FalconX — ETF flows and Bitcoin price (Oct 11, 2024); SEC — in-kind creations and redemptions for crypto ETPs (Jul 29, 2025); Tiger Newspress — crypto ETFs in 2025 recap (Dec 30, 2025); CoinGecko — Bitcoin price history; Farside Investors — daily flow table. Checked on Oct 6, 2026.
Read more
A sound market reading combines data, context and clear risk limits.