
Bitcoin’s August 2026 rally versus the world’s largest stock markets
A quantitative comparison, cut off on 28 August 2026, between Bitcoin’s rally and major equity benchmarks.
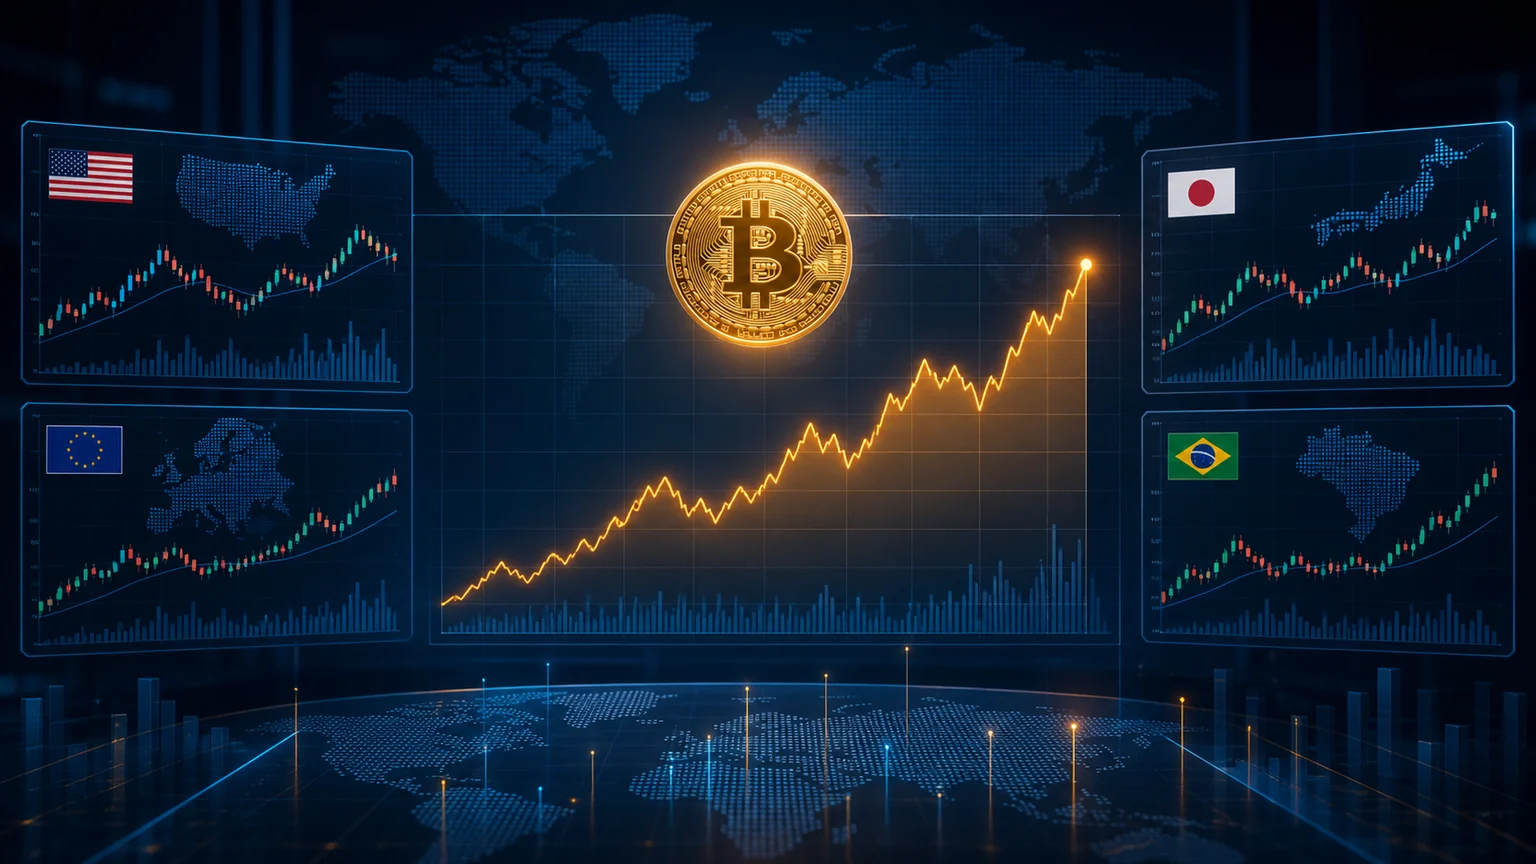
Direct answer: Bitcoin moved much faster in August
Through 29 August 2026, Bitcoin was up about 25.8% in August, rising from roughly US$62.2k at the start of the month to near US$79k at the 28 August close. The comparison needs context: Bitcoin trades around the clock, while equities trade in sessions and each index is denominated in a different currency.
Comparison at the 28 August cut-off
| Reference | Period | Change | Source and note |
|---|---|---|---|
| Bitcoin (BTC/USD) | August through 29 Aug | +25.8% | OpenBitcoin; approximate close near US$79,017 |
| Nasdaq Composite | Year through 28 Aug | +13.6% | AP; price-index change |
| S&P 500 | Year through 28 Aug | +12.7% | AP; price-index change |
| Dow Jones | Year through 28 Aug | +11.4% | AP; price-index change |
| STOXX Europe 600 | Month through 28 Aug | +1.28% | Teleborsa; euro quotation |
| STOXX Europe 600 | Year through 28 Aug | +10.63% | Teleborsa; euro quotation |
| Nikkei 225 | 28 Aug | +0.41% that day | Nikkei Indexes; close at 66,405.56 |
| Ibovespa | 28 Aug | +0.30% that day | IBOVX; close at 175,664.62 |
This does not mean every equity market was flat in August. It means Bitcoin’s single-month move was much more concentrated and faster than the daily moves shown in the table. Monthly, year-to-date and daily returns are different measures.
Why was the amplitude different?
Bitcoin’s liquidity is smaller and more fragmented than that of major equity markets. Capital flows can therefore move its price by larger percentages. Coverage of the August rally linked it to a weaker dollar, lower Treasury yields, renewed spot-ETF demand and concern about currency debasement.
Equity gains were broader and slower. By 28 August, the Nasdaq was up 13.6% for the year, the S&P 500 12.7% and the Dow 11.4%; STOXX Europe 600 was up 10.63%. Those are meaningful gains spread across months and many companies, not a single monthly impulse.
Bitcoin is not a global stock index
The S&P 500 represents large US companies; the Nasdaq has a strong technology weight; the Dow contains 30 companies; STOXX Europe 600 covers 600 companies in 17 countries; Nikkei tracks Japanese equities; and Ibovespa represents Brazil’s stock market. They have different currencies, constituents, trading hours and calculation methods.
We also do not use total returns including dividends. The quoted equity figures are index-point changes, while Bitcoin does not distribute dividends. A real portfolio would add currency effects, fees, taxes, dividends and rebalancing.
Volatility and reversal risk
Bitcoin’s August range — roughly US$62.2k to US$81.2k — was close to 31% from low to high. A positive month-end return can therefore coexist with severe losses during the path. A strong August is not evidence that September must continue higher, and it does not prove that equities are permanently lagging.
Methodology and limitations
Consulted on 29 August 2026. BTC’s monthly return uses OpenBitcoin’s daily series; Nasdaq, S&P 500 and Dow Jones year-to-date figures come from Associated Press on 28 August; STOXX Europe 600 and Ibovespa use historical quotes at the same cut-off; Nikkei uses its official 28 August bulletin. This is a market snapshot, not a standardized total-return series or investment recommendation. Closing times, currencies and rounding can change small decimals.
Sources
- OpenBitcoin — daily Bitcoin prices in August 2026.
- Associated Press — US index performance on 28 August 2026.
- Teleborsa — STOXX Europe 600.
- Nikkei Indexes — 28 August 2026 bulletin.
- IBOVX — Ibovespa historical data.
Informational and educational content. It is not investment advice, an offer or a solicitation to buy or sell assets.
Read more
- Bitcoin beyond price: a guide to reading volume, liquidity and dominance
- How to read the crypto market today: price, volume and dominance
- Altcoin season: how to identify it and understand the risks
- Bitcoin price history: cycles and maximum drawdowns
- The 5 leading cryptocurrencies by market capitalization
A sound market reading combines data, context and clear risk limits.